The default hue color scale from ggplot2.
Examples
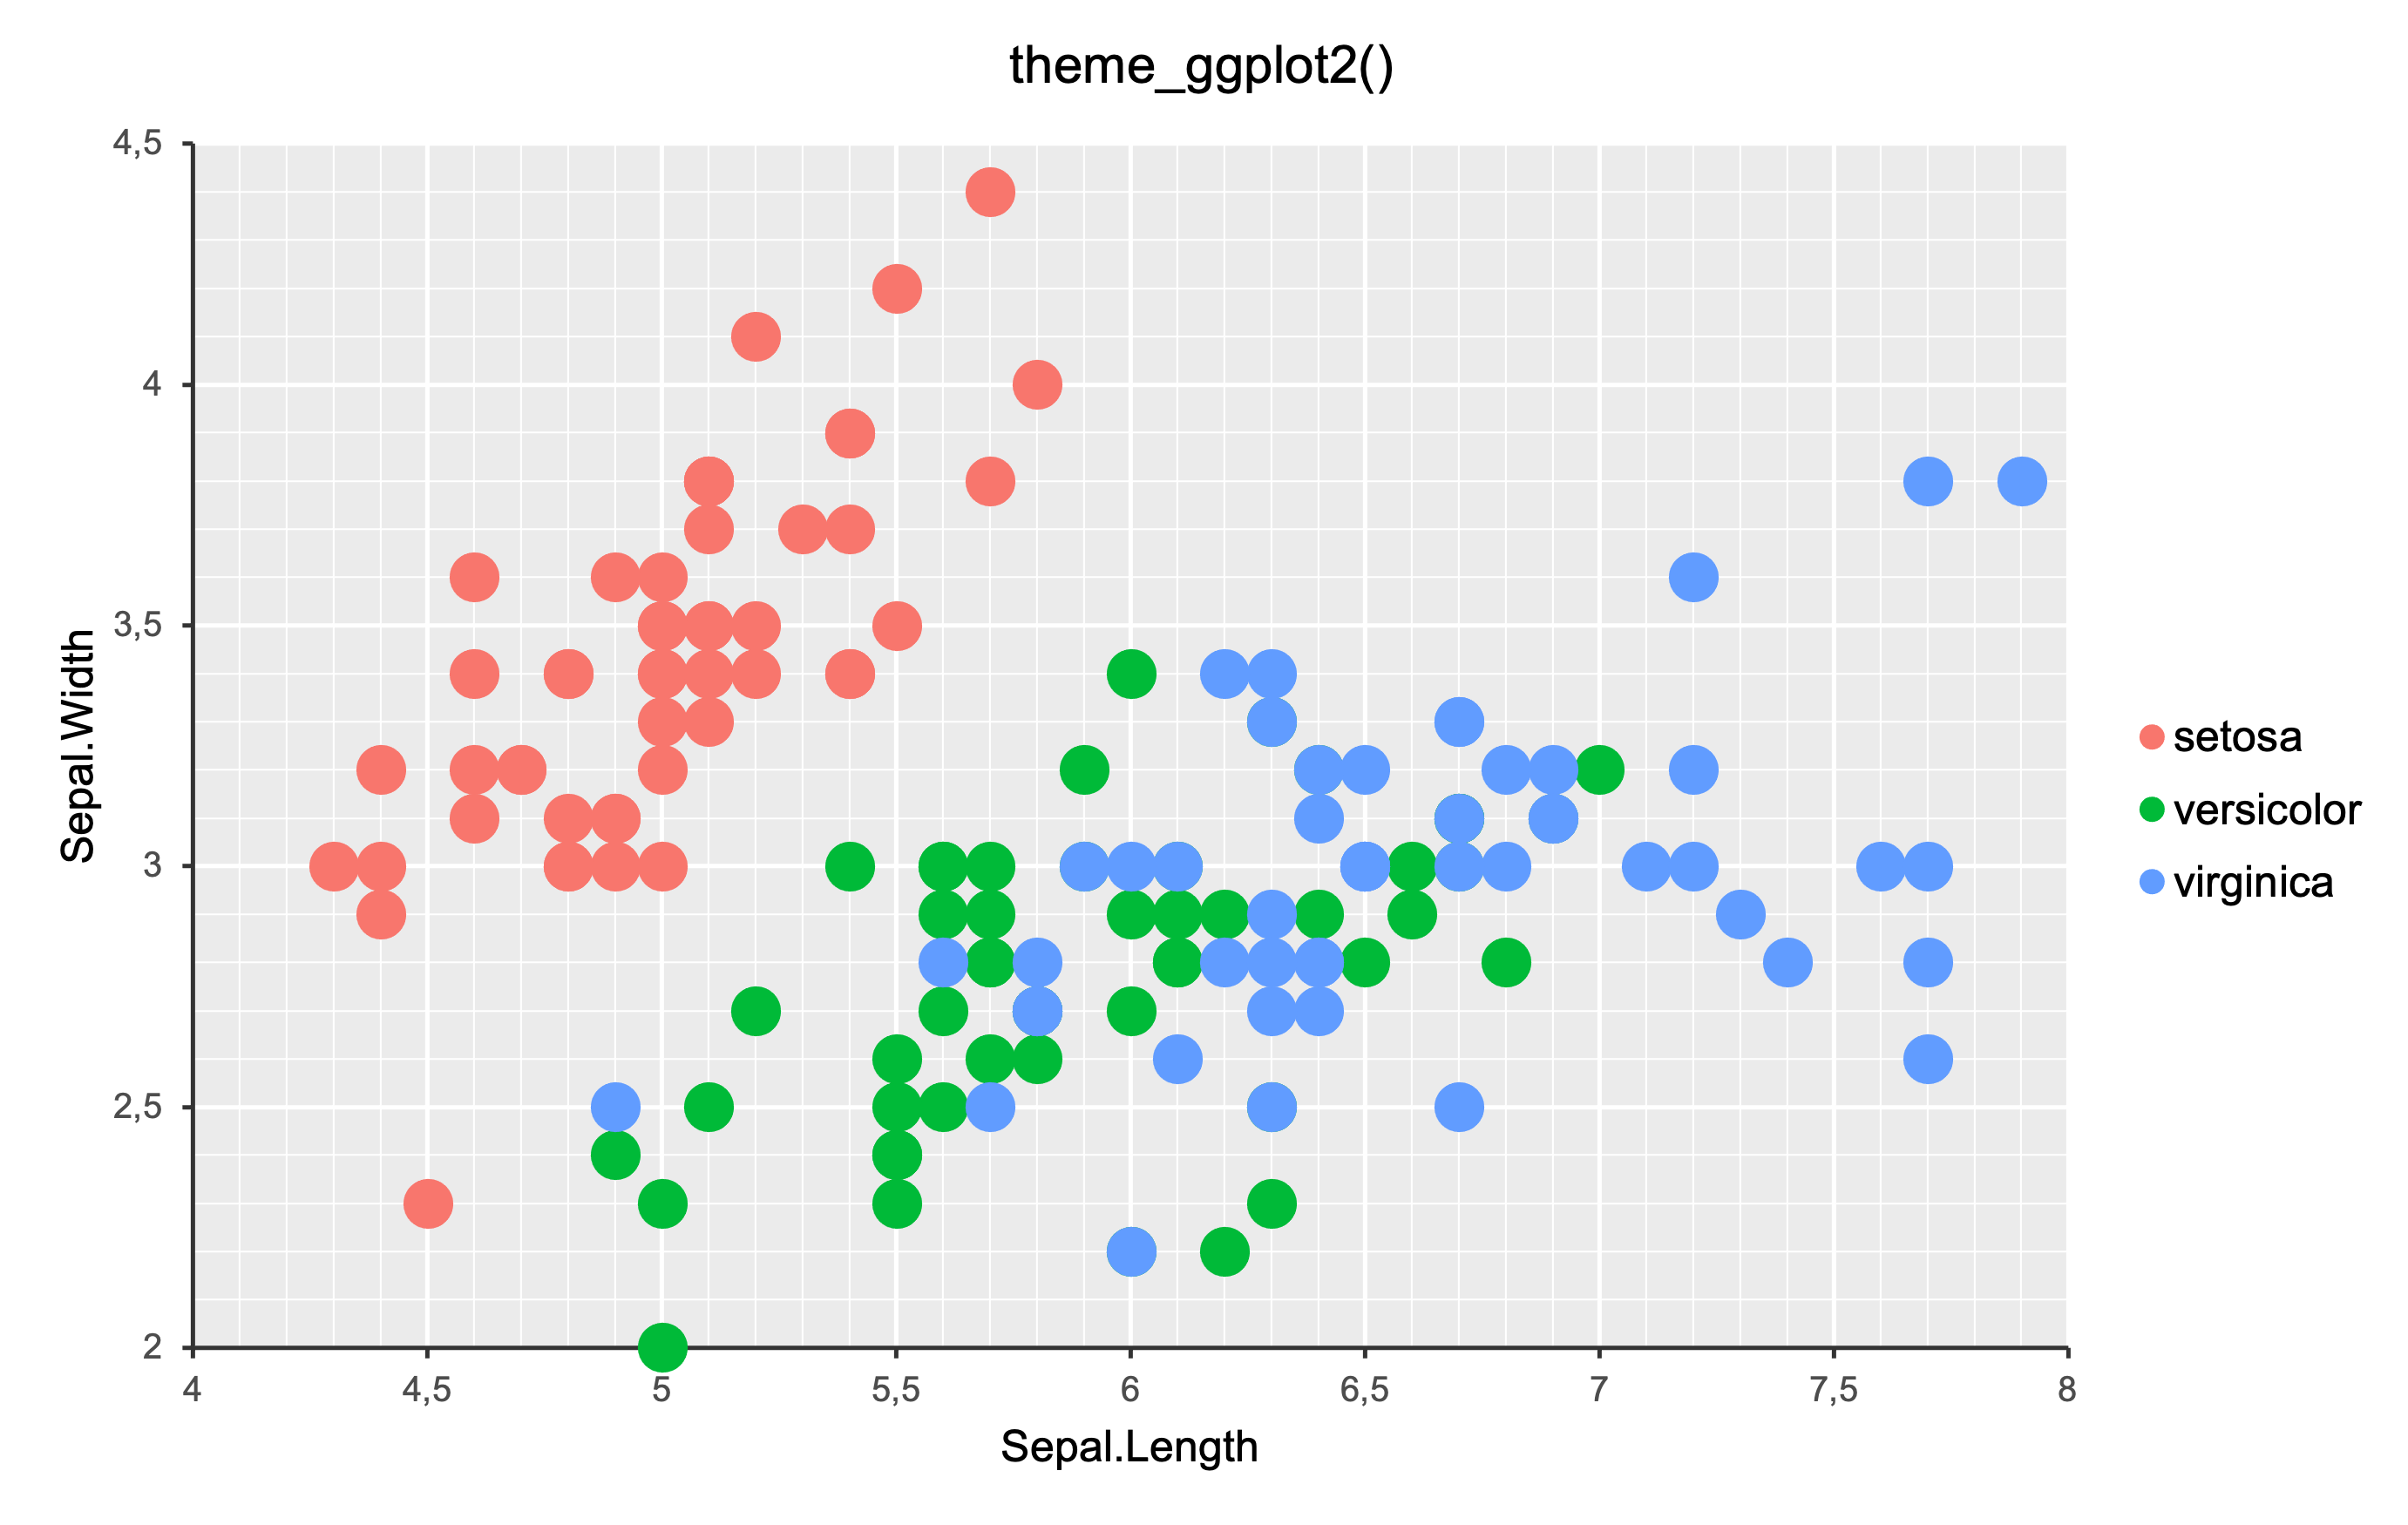
p <- ms_scatterchart(
  data = iris, x = "Sepal.Length",
  y = "Sepal.Width", group = "Species"
)

p <- theme_ggplot2(p)
p <- chart_fill_ggplot2(p)
The default hue color scale from ggplot2.
p <- ms_scatterchart(
data = iris, x = "Sepal.Length",
y = "Sepal.Width", group = "Species"
)
p <- theme_ggplot2(p)
p <- chart_fill_ggplot2(p)