Creation of a scatterchart object that can be inserted in a 'Microsoft' document.
ms_scatterchart(data, x, y, group = NULL, labels = NULL, asis = FALSE)Arguments
- data
a data.frame
- x
x colname
- y
y colname
- group
grouping colname used to split data into series. Optional.
- labels
colnames of columns to be used as labels into series. Optional. If more than a name, only the first one will be used as label, but all labels (transposed if a group is used) will be available in the Excel file associated with the chart.
- asis
bool parameter defaulting to FALSE. If TRUE the data will not be modified.
Illustrations


See also
chart_settings(), chart_ax_x(), chart_ax_y(),
chart_data_labels(), chart_theme(), chart_labels()
Other 'Office' chart objects:
ms_areachart(),
ms_barchart(),
ms_linechart()
Examples
library(officer)
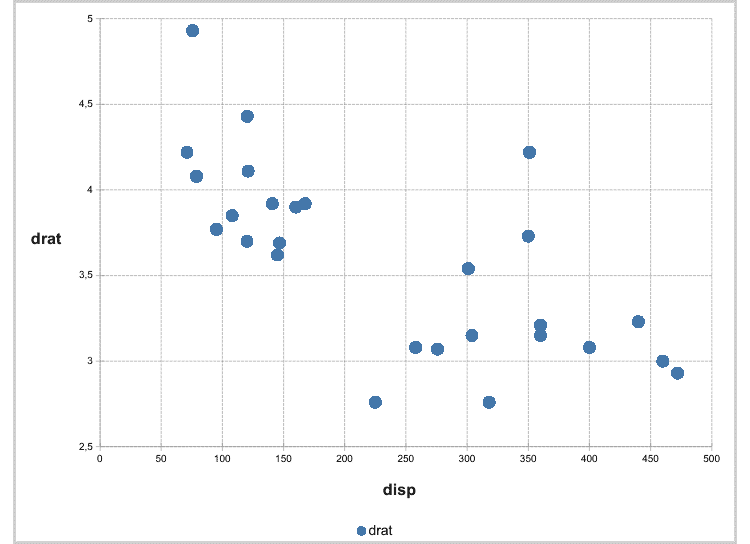
# example chart_01 -------
chart_01 <- ms_scatterchart(
  data = mtcars, x = "disp",
  y = "drat"
)
chart_01 <- chart_settings(chart_01, scatterstyle = "marker")


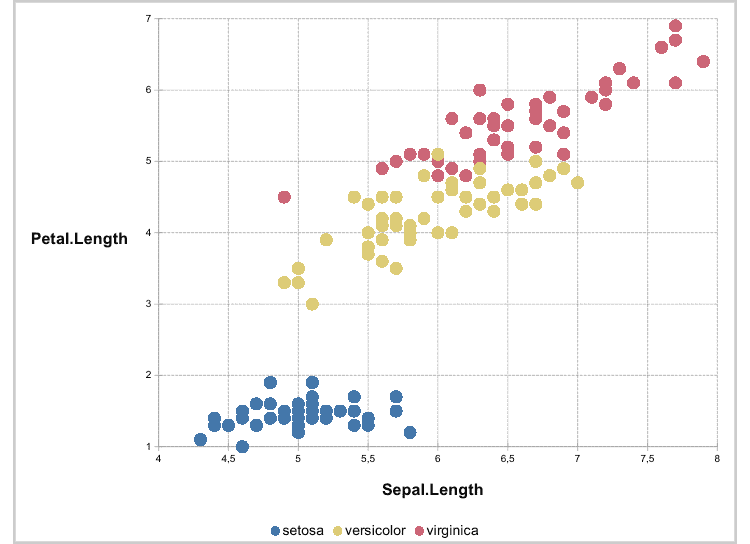
# example chart_02 -------
chart_02 <- ms_scatterchart(
  data = iris, x = "Sepal.Length",
  y = "Petal.Length", group = "Species"
)
chart_02 <- chart_settings(chart_02, scatterstyle = "marker")