Set chart properties.
Usage
chart_settings(x, ...)

# S3 method for class 'ms_chart_ex'
chart_settings(x, ...)

# S3 method for class 'ms_barchart'
chart_settings(x, vary_colors, gap_width, dir, grouping, overlap, table, ...)

# S3 method for class 'ms_linechart'
chart_settings(x, vary_colors, style, grouping, table, ...)

# S3 method for class 'ms_areachart'
chart_settings(x, vary_colors, grouping, table, ...)

# S3 method for class 'ms_scatterchart'
chart_settings(x, vary_colors, style, ...)

# S3 method for class 'ms_stockchart'
chart_settings(
  x,
  vary_colors,
  table,
  hi_low_lines,
  up_bars_fill,
  up_bars_border,
  down_bars_fill,
  down_bars_border,
  ...
)

# S3 method for class 'ms_radarchart'
chart_settings(x, vary_colors, style, ...)

# S3 method for class 'ms_bubblechart'
chart_settings(x, vary_colors, bubble3D = FALSE, ...)

# S3 method for class 'ms_piechart'
chart_settings(x, vary_colors, hole_size, ...)

# S3 method for class 'ms_paretochart'
chart_settings(x, line, ...)

# S3 method for class 'ms_boxplotchart'
chart_settings(x, line, ...)
Arguments
- x
an
ms_chartobject.- ...
unused parameter
- vary_colors
if
TRUE, each data point in a single series is displayed in a different color.- gap_width
A gap appears between the bar or clustered bars for each category on a bar chart. The default width for this gap is 150 percent of the bar width. It can be set between 0 and 500 percent of the bar width.
- dir
the direction of the bars in the chart, value must be one of "horizontal" or "vertical".
- grouping
grouping of the series. For a barchart one of "percentStacked", "clustered", "standard" or "stacked". For a linechart or an areachart one of "percentStacked", "standard" or "stacked" ("clustered" is bar-only).
- overlap
In a bar chart having two or more series, the bars for each category are clustered together. By default, these bars are directly adjacent to each other. The bars can be made to overlap each other or have a space between them using the overlap property. Its values range between -100 and 100, representing the percentage of the bar width by which to overlap adjacent bars. A setting of -100 creates a gap of a full bar width and a setting of 100 causes all the bars in a category to be superimposed. The default value is 0.
- table
if
TRUEset a table below the barchart.- style
Style for the linechart or scatterchart type of markers. One of 'none', 'line', 'lineMarker', 'marker', 'smooth', 'smoothMarker'.
- hi_low_lines
an
officer::fp_border()for the high-low lines. Set toFALSEto hide them.- up_bars_fill
fill colour for up bars (OHLC only, close > open).
- up_bars_border
an
officer::fp_border()for up bar borders.- down_bars_fill
fill colour for down bars (OHLC only, close < open).
- down_bars_border
an
officer::fp_border()for down bar borders.- bubble3D
logical, use 3D effect for bubbles.
- hole_size
size of the hole in a doughnut chart, between 0 and 90 (percent of the radius). Default 0 produces a pie chart; values above 0 produce a doughnut chart.
- line
stroke for the cumulative percentage line. One of:
NULL(default, matches Excel-native: themeaccent2colour scaled to chart palette),FALSEto suppress the line override (line then depends on the chartstyle sidecar and may render as invisible), or anofficer::fp_border().
Methods (by class)
chart_settings(ms_chart_ex): fallback for chartEx types that expose no settings (funnel, histogram, sunburst, treemap, waterfall). Replaces the defaultno applicable methoderror with a discoverable message.chart_settings(ms_barchart): barchart settingschart_settings(ms_linechart): linechart settingschart_settings(ms_areachart): areachart settingschart_settings(ms_scatterchart): scatterchart settingschart_settings(ms_stockchart): stockchart settingschart_settings(ms_radarchart): radarchart settingschart_settings(ms_bubblechart): bubblechart settingschart_settings(ms_piechart): piechart settingschart_settings(ms_paretochart): paretochart settingschart_settings(ms_boxplotchart): boxplotchart settings
Examples
library(mschart)
library(officer)
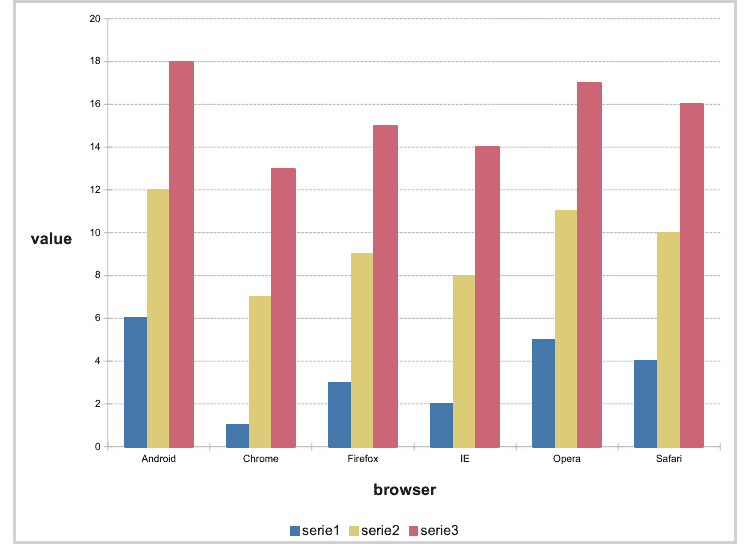
chart_01 <- ms_barchart(
data = browser_data, x = "browser",
y = "value", group = "serie"
)
chart_01 <- chart_theme(chart_01,
grid_major_line_x = fp_border(width = 0),
grid_minor_line_x = fp_border(width = 0)
)
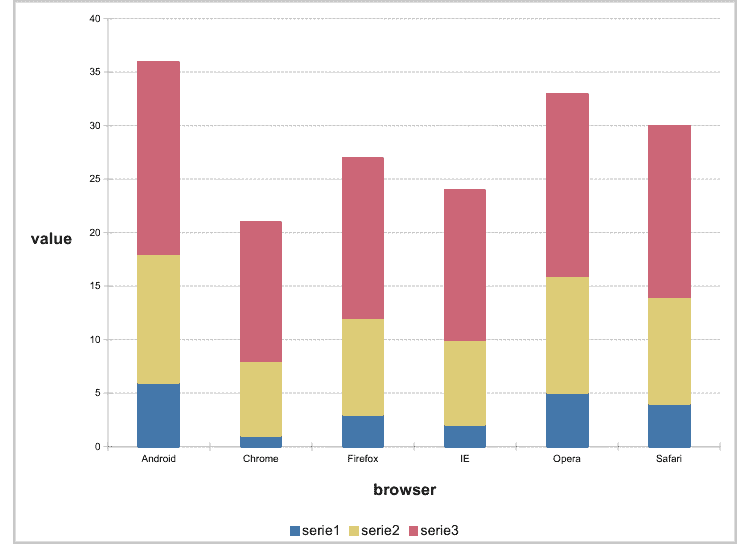
chart_02 <- chart_settings(
x = chart_01,
grouping = "stacked", overlap = 100
)
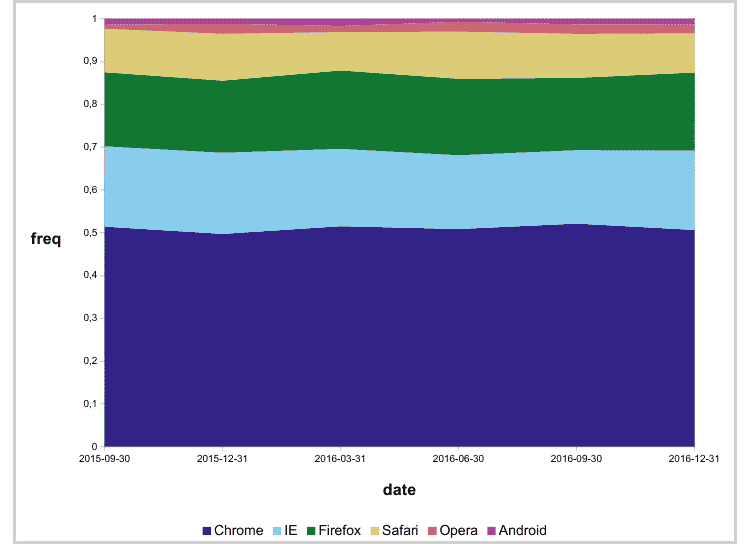
chart_03 <- ms_areachart(
data = browser_ts, x = "date",
y = "freq", group = "browser"
)
chart_03 <- chart_settings(chart_03,
grouping = "percentStacked"
)