Define settings for a y axis. S3 generic; the
default method is documented below. ChartEx charts have a leaner
set of supported options - see the package documentation.
Usage
chart_ax_y(x, ...)

# Default S3 method
chart_ax_y(
  x,
  orientation,
  crosses,
  cross_between,
  major_tick_mark,
  minor_tick_mark,
  tick_label_pos,
  display,
  num_fmt,
  rotation,
  limit_min,
  limit_max,
  position,
  major_unit,
  minor_unit,
  major_time_unit,
  minor_time_unit,
  ...
)
Arguments
- x
an
ms_chartobject.- ...
arguments passed to S3 methods.
- orientation
axis orientation, one of 'maxMin', 'minMax'.
- crosses
specifies how the axis crosses the perpendicular axis, one of 'autoZero', 'max', 'min'.
- cross_between
specifies how the value axis crosses the category axis between categories, one of 'between', 'midCat'.
- major_tick_mark, minor_tick_mark
tick marks position, one of 'cross', 'in', 'none', 'out'.
- tick_label_pos
ticks labels position, one of 'high', 'low', 'nextTo', 'none'.
- display
should the axis be displayed (a logical of length 1).
- num_fmt
number formatting. See the num_fmt section for more details.
- rotation
rotation angle. Value should be between
-360and360.- limit_min
minimum value on the axis. Date objects are also accepted and will be converted automatically.
- limit_max
maximum value on the axis. Date objects are also accepted and will be converted automatically.
- position
the value at which this axis crosses the perpendicular axis.
- major_unit
numeric, interval between major ticks and gridlines.
- minor_unit
numeric, interval between minor ticks and gridlines.
- major_time_unit
time unit for major ticks on date axes, one of
"days","months","years".- minor_time_unit
time unit for minor ticks on date axes, one of
"days","months","years".
num_fmt
All % need to be doubled, 0%% means "a number
and percent symbol".
To my current knowledge, depending on the chart type
and options, the following values are not systematically
used by office chart engine; i.e. when chart pre-compute
percentages, it seems using 0%% will have no
effect.
General: default value0: display the number with no decimal0.00: display the number with two decimals0%%: display as percentages0.00%%: display as percentages with two decimal places#,##0#,##0.000.00E+00# ?/?# ??/??mm-dd-yyd-mmm-yyd-mmmmmm-yyh:mm AM/PMh:mm:ss AM/PMh:mmh:mm:ssm/d/yy h:mm#,##0 ;(#,##0)#,##0 ;[Red](#,##0)#,##0.00;(#,##0.00)#,##0.00;[Red](#,##0.00)mm:ss[h]:mm:ssmmss.0##0.0E+0@
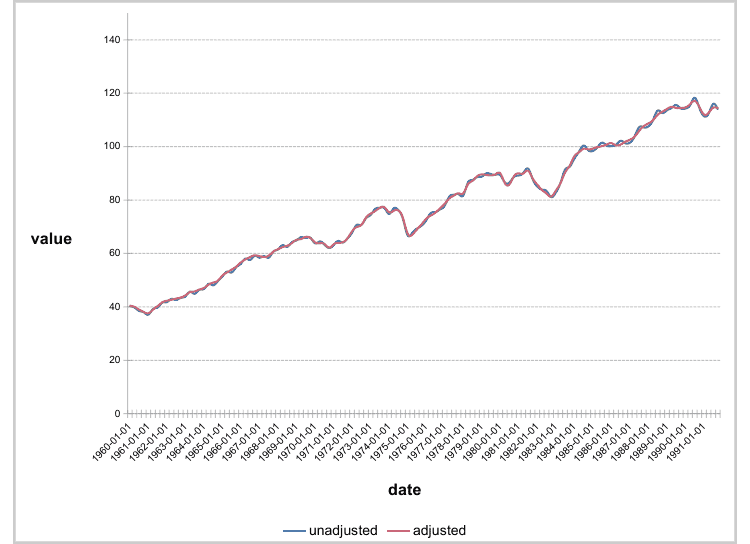
Examples
library(officer)
library(mschart)

chart_01 <- ms_linechart(
  data = us_indus_prod,
  x = "date", y = "value",
  group = "type"
)
chart_01 <- chart_settings(chart_01, style = "marker")
chart_01 <- chart_ax_x(
  x = chart_01, num_fmt = "[$-fr-FR]mmm yyyy",
  limit_min = min(us_indus_prod$date),
  limit_max = as.Date("1992-01-01")
)
chart_01
#> * 'ms_linechart' object
#>
#> * original data [256,3] (sample):
#>         date       type value
#> 1 1960-01-01 unadjusted  40.2
#> 2 1960-04-01 unadjusted  39.8
#> 3 1960-07-01 unadjusted  38.5
#> 4 1960-10-01 unadjusted  38.0
#> 5 1961-01-01 unadjusted  37.1
#>
#> * series data [128,3] (sample):
#>         date unadjusted adjusted
#> 1 1960-01-01       40.2     40.5
#> 2 1960-04-01       39.8     40.0
#> 3 1960-07-01       38.5     39.0
#> 4 1960-10-01       38.0     38.1
#> 5 1961-01-01       37.1     37.6