Interactive leaflet plotting for entry points
plot_risk.RdHelper function to plot riskintro's default risks using ggplot2.
Usage
plot_entry_points_interactive(dataset, scale, risk_col, ll = new_leaflet())

plot_animal_mobility_interactive(dataset, scale, risk_col, ll = new_leaflet())

plot_road_access_interactive(dataset, scale, risk_col, ll = new_leaflet())

plot_border_risk_interactive(dataset, scale, risk_col, ll = new_leaflet())

plot_epi_units_interactive(dataset, scale, risk_col, ll = new_leaflet())

plot_risk_table_interactive(dataset, scale, risk_col, ll = new_leaflet())

plot_risk(
  dataset,
  risk_name = NULL,
  risk_col = NULL,
  scale = NULL,
  interactive = FALSE
)

plot_entry_points(dataset, scale, risk_col)

plot_animal_mobility(dataset, scale, risk_col)

plot_road_access(dataset, scale, risk_col)

plot_border_risk(dataset, scale, risk_col)

plot_border_risk(dataset, scale, risk_col)

plot_epi_units(dataset, scale, risk_col)

plot_risk_table(dataset, scale, risk_col)
Arguments
- dataset
risk table, generally the output of a
- scale
the scale of
risk_col, numeric vector of length 2, this is NULL by default and is inferred fromattr(x, "scale").- risk_col
the risk column to represent in the visualisation, this is NULL by default and is inferred from
attr(x, "risk_col").- ll
leaflet object to add layers to
- risk_name
risk_name used to determine which plotting function to use, this is NULL by default and is inferred from
attr(x, "table_name").- interactive
default to FALSE for ggplot2 visuals, TRUE returns interactive leaflet.
Value
leaflet map object
leaflet map object
leaflet map object
leaflet map object
leaflet map object
leaflet map object
ggplot2 object with the appropriate visualisation if interactive is FALSE, otherwise, leaflet object
Examples
tunisia_raw <- sf::read_sf(system.file(
package = "riskintrodata",
"samples", "tunisia", "epi_units", "tunisia_adm2_raw.gpkg"
))
# Apply mapping to prepare colnames and validate dataset
tunisia <- apply_mapping(
tunisia_raw,
mapping = mapping_epi_units(
eu_name = "NAME_2",
geometry = "geom"
),
validate = TRUE
)
#> ✔ All data in "epi_units" valided.
entry_points_fp <-
system.file(
package = "riskintrodata",
"samples",
"tunisia",
"entry_points", "BORDER_CROSSING_POINTS.csv"
)
entry_points <- readr::read_csv(entry_points_fp)
#> Rows: 110 Columns: 6
#> ── Column specification ────────────────────────────────────────────────────────
#> Delimiter: ","
#> chr (4): NAME, TYPE, MODE, SOURCES
#> dbl (2): LONGITUDE_X, LATITUDE_Y
#>
#> ℹ Use `spec()` to retrieve the full column specification for this data.
#> ℹ Specify the column types or set `show_col_types = FALSE` to quiet this message.
entry_points <- apply_mapping(
dataset = entry_points,
mapping = mapping_entry_points(
point_name = "NAME",
lng = "LONGITUDE_X",
lat = "LATITUDE_Y",
mode = "MODE",
type = "TYPE",
sources = "SOURCES"
),
validate = TRUE
)
#> ✔ All data in "entry_points" valided.
ri_entry_points <- calc_entry_point_risk(
entry_points = entry_points,
epi_units = tunisia,
emission_risk =
calc_emission_risk(
emission_risk_factors = riskintrodata::get_wahis_erf(
disease = "Anthrax",
species = "Cattle",
animal_category = "Domestic"
)
)
) |>
rescale_risk_scores()
#> ✔ All data in "emission_risk_factors" valided.
#> ✔ WAHIS emission risk factors dataset has 65 entries for `disease = Anthrax`, `species = Cattle`, and `animal_category = Domestic`.
#> Warning: ! There are missing emission risk scores for the following countries:
#> • BIH missing for 1 entry points.
#> • BRN missing for 1 entry points.
#> • DZA missing for 44 entry points.
#> • ESP missing for 1 entry points.
#> • FRA missing for 1 entry points.
#> • HUN missing for 2 entry points.
#> • ISR missing for 1 entry points.
#> • LBY missing for 12 entry points.
#> • MAR missing for 1 entry points.
#> • NOR missing for 1 entry points.
#> • PER missing for 1 entry points.
#> • PHL missing for 1 entry points.
#> • VNM missing for 1 entry points.
#> • ZAF missing for 1 entry points.
#> Create new entries in the emission risk factor table using `erf_row()`
#> (`?riskintrodata::erf_row()`).
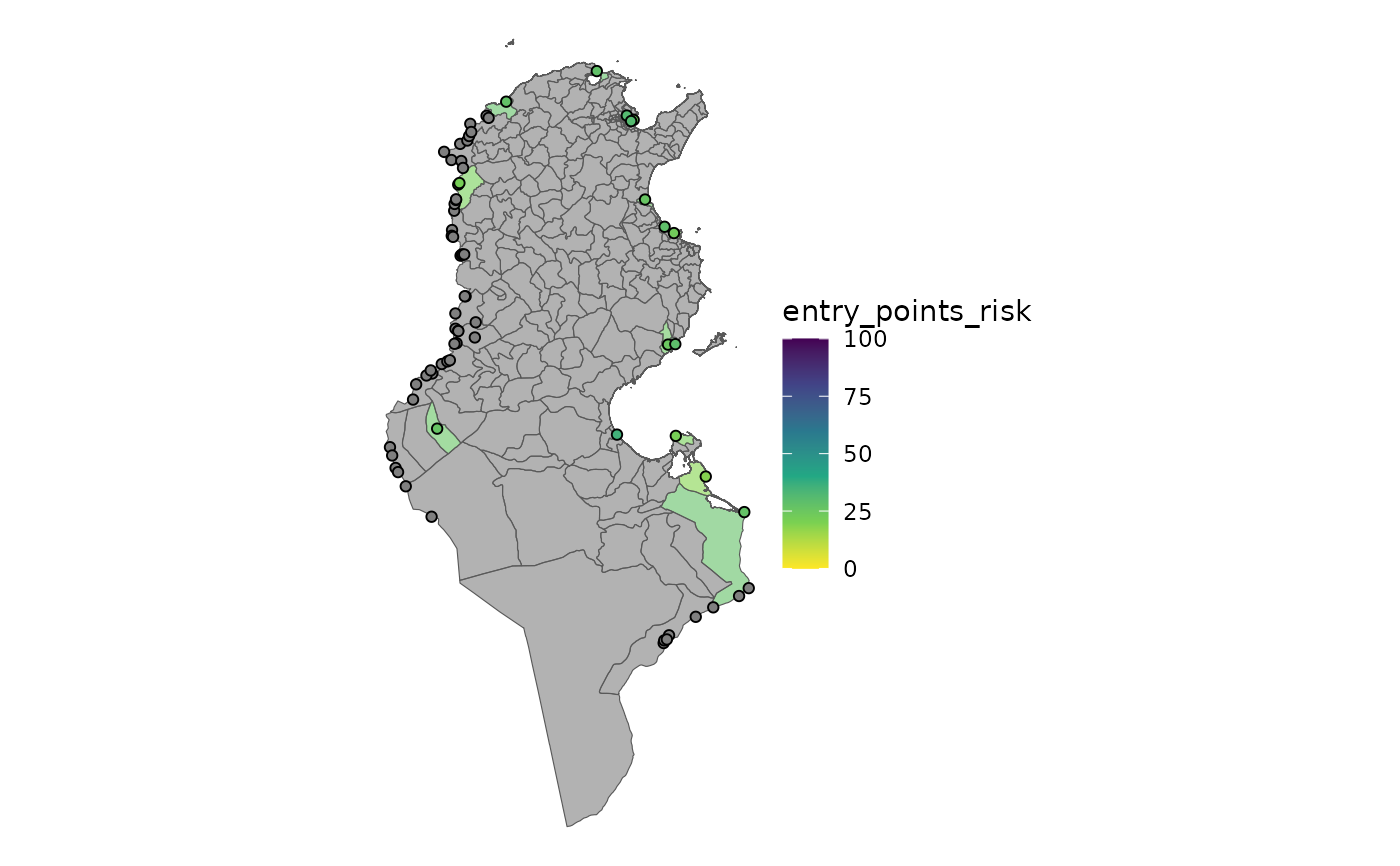
plot_risk(ri_entry_points, interactive = FALSE)
 plot_risk(ri_entry_points, interactive = TRUE)