
library(munch)
library(ggplot2)
library(flextable)
library(gdtools)
fset <- font_set_liberation()
set_theme(theme_minimal(base_family = "Liberation Sans", base_size = 11))
This vignette covers formatting in ‘ggplot2’ theme elements and text annotations using ‘munch’.
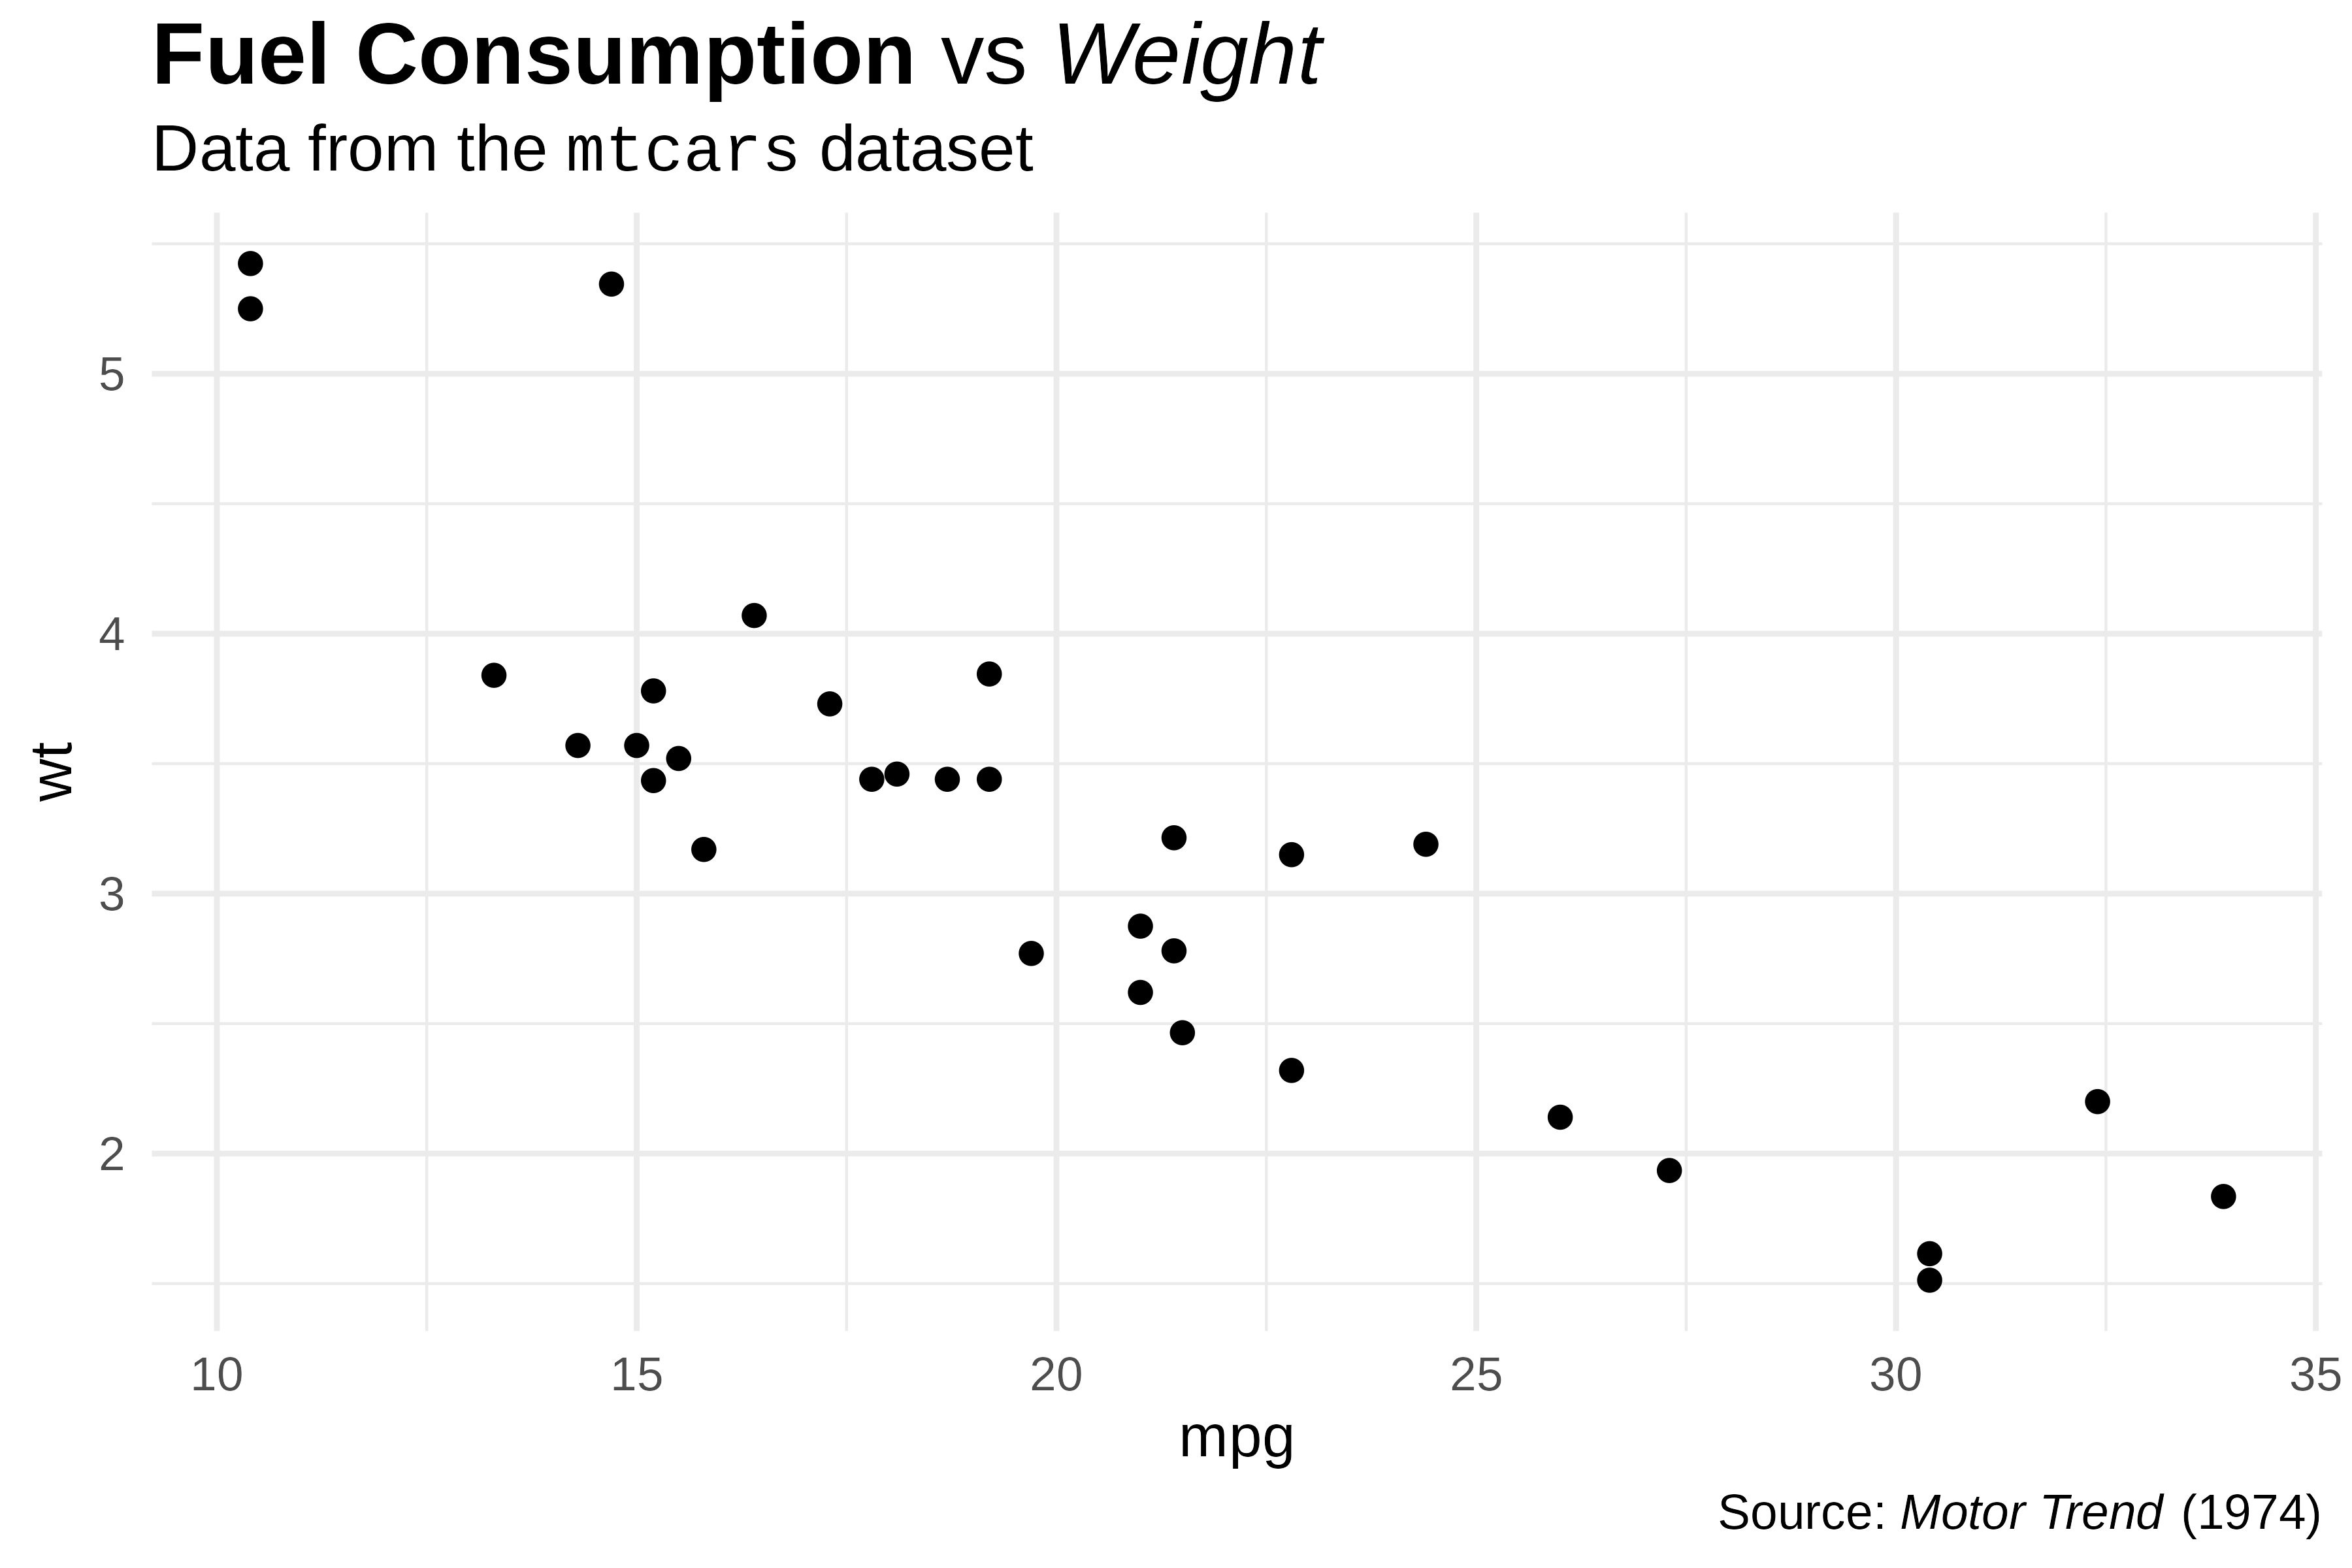
Simple markdown with element_md()
element_md() replaces element_text() to
render markdown in titles, subtitles, captions, and axis labels.
ggplot(mtcars, aes(mpg, wt)) +
  geom_point() +
  labs(
    title = "**Fuel Consumption** vs *Weight*",
    subtitle = "Data from the `mtcars` dataset",
    caption = "Source: *Motor Trend* (1974)"
  ) +
  theme(
    plot.title = element_md(size = 16),
    plot.subtitle = element_md(size = 12, code_font_family = "Liberation Mono"),
    plot.caption = element_md(size = 9)
  )
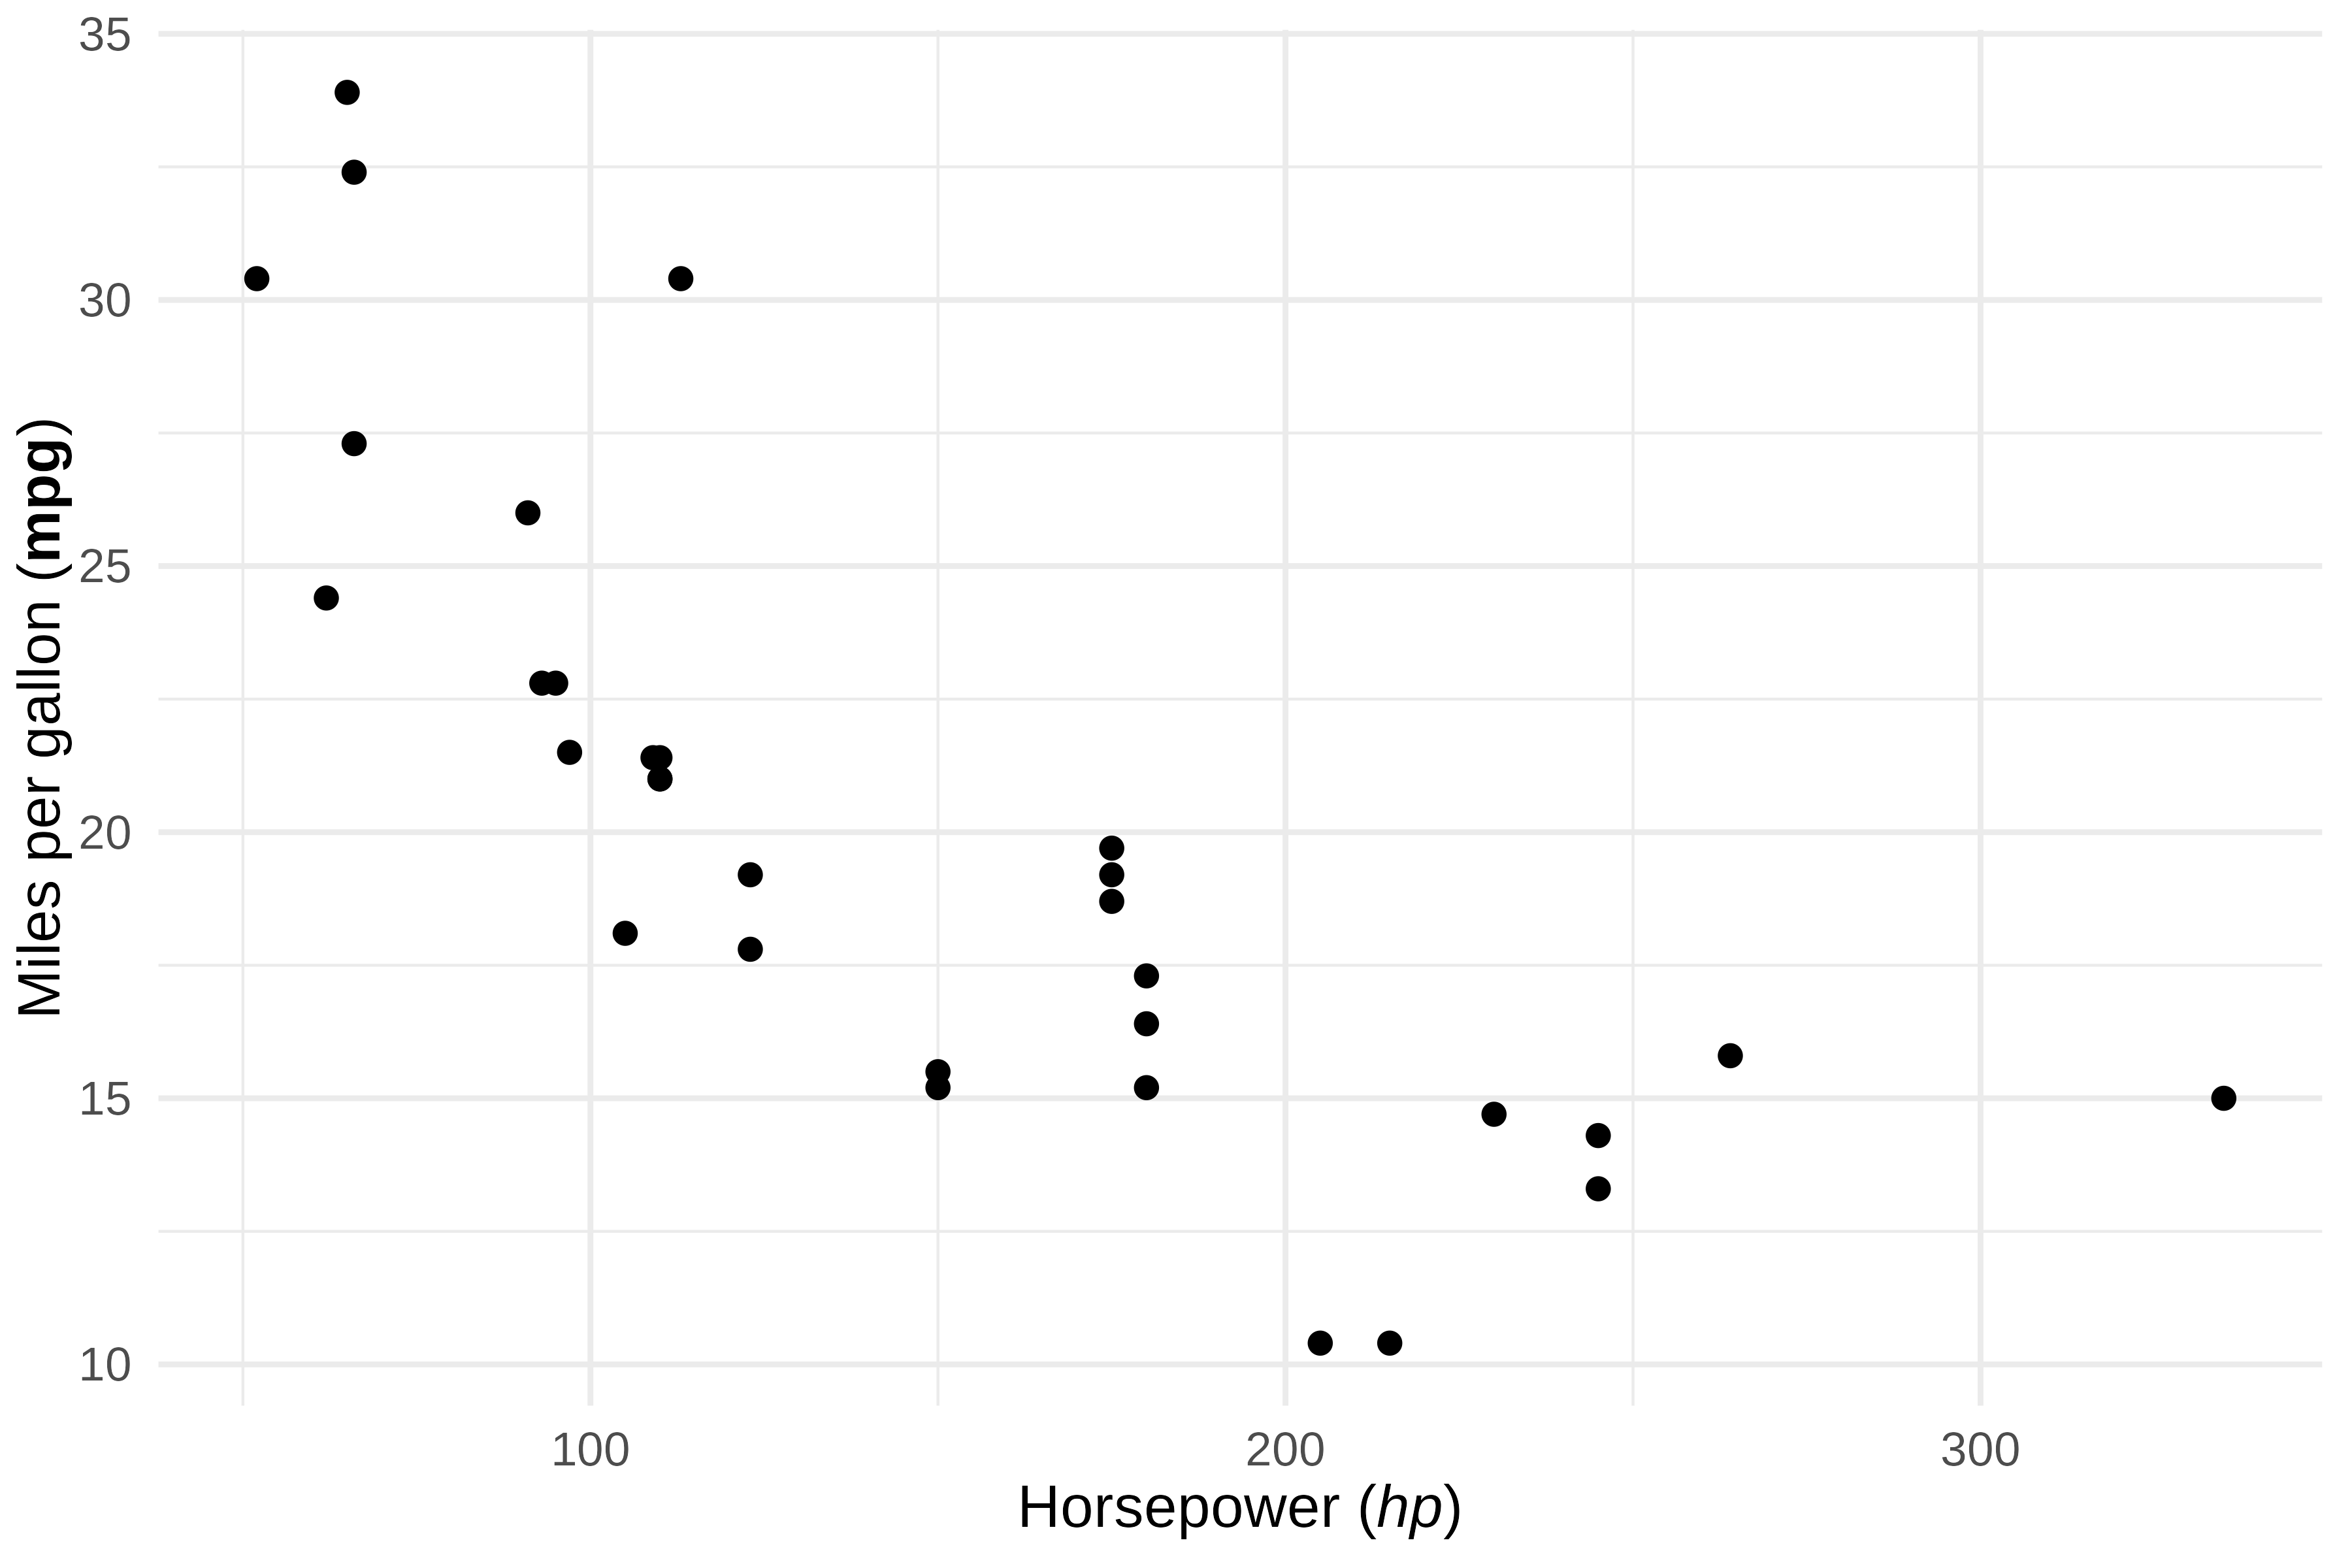
ggplot(mtcars, aes(hp, mpg)) +
  geom_point() +
  labs(
    x = "Horsepower (*hp*)",
    y = "Miles per gallon (**mpg**)"
  ) +
  theme(
    axis.title.x = element_md(),
    axis.title.y = element_md()
  )
For advanced markdown rendering (images, spans, custom CSS), see also
marquee::element_marquee().
Long titles
Titles, subtitles and captions wrap to the width of their column, and the plot keeps the space they need:
long_title <- paste(
  "A **long title** that needs several lines, because it is wider",
  "than the *panel* of the plot"
)

p <- ggplot(mtcars, aes(mpg, wt)) +
  geom_point() +
  labs(title = long_title) +
  theme(plot.title = element_md())
p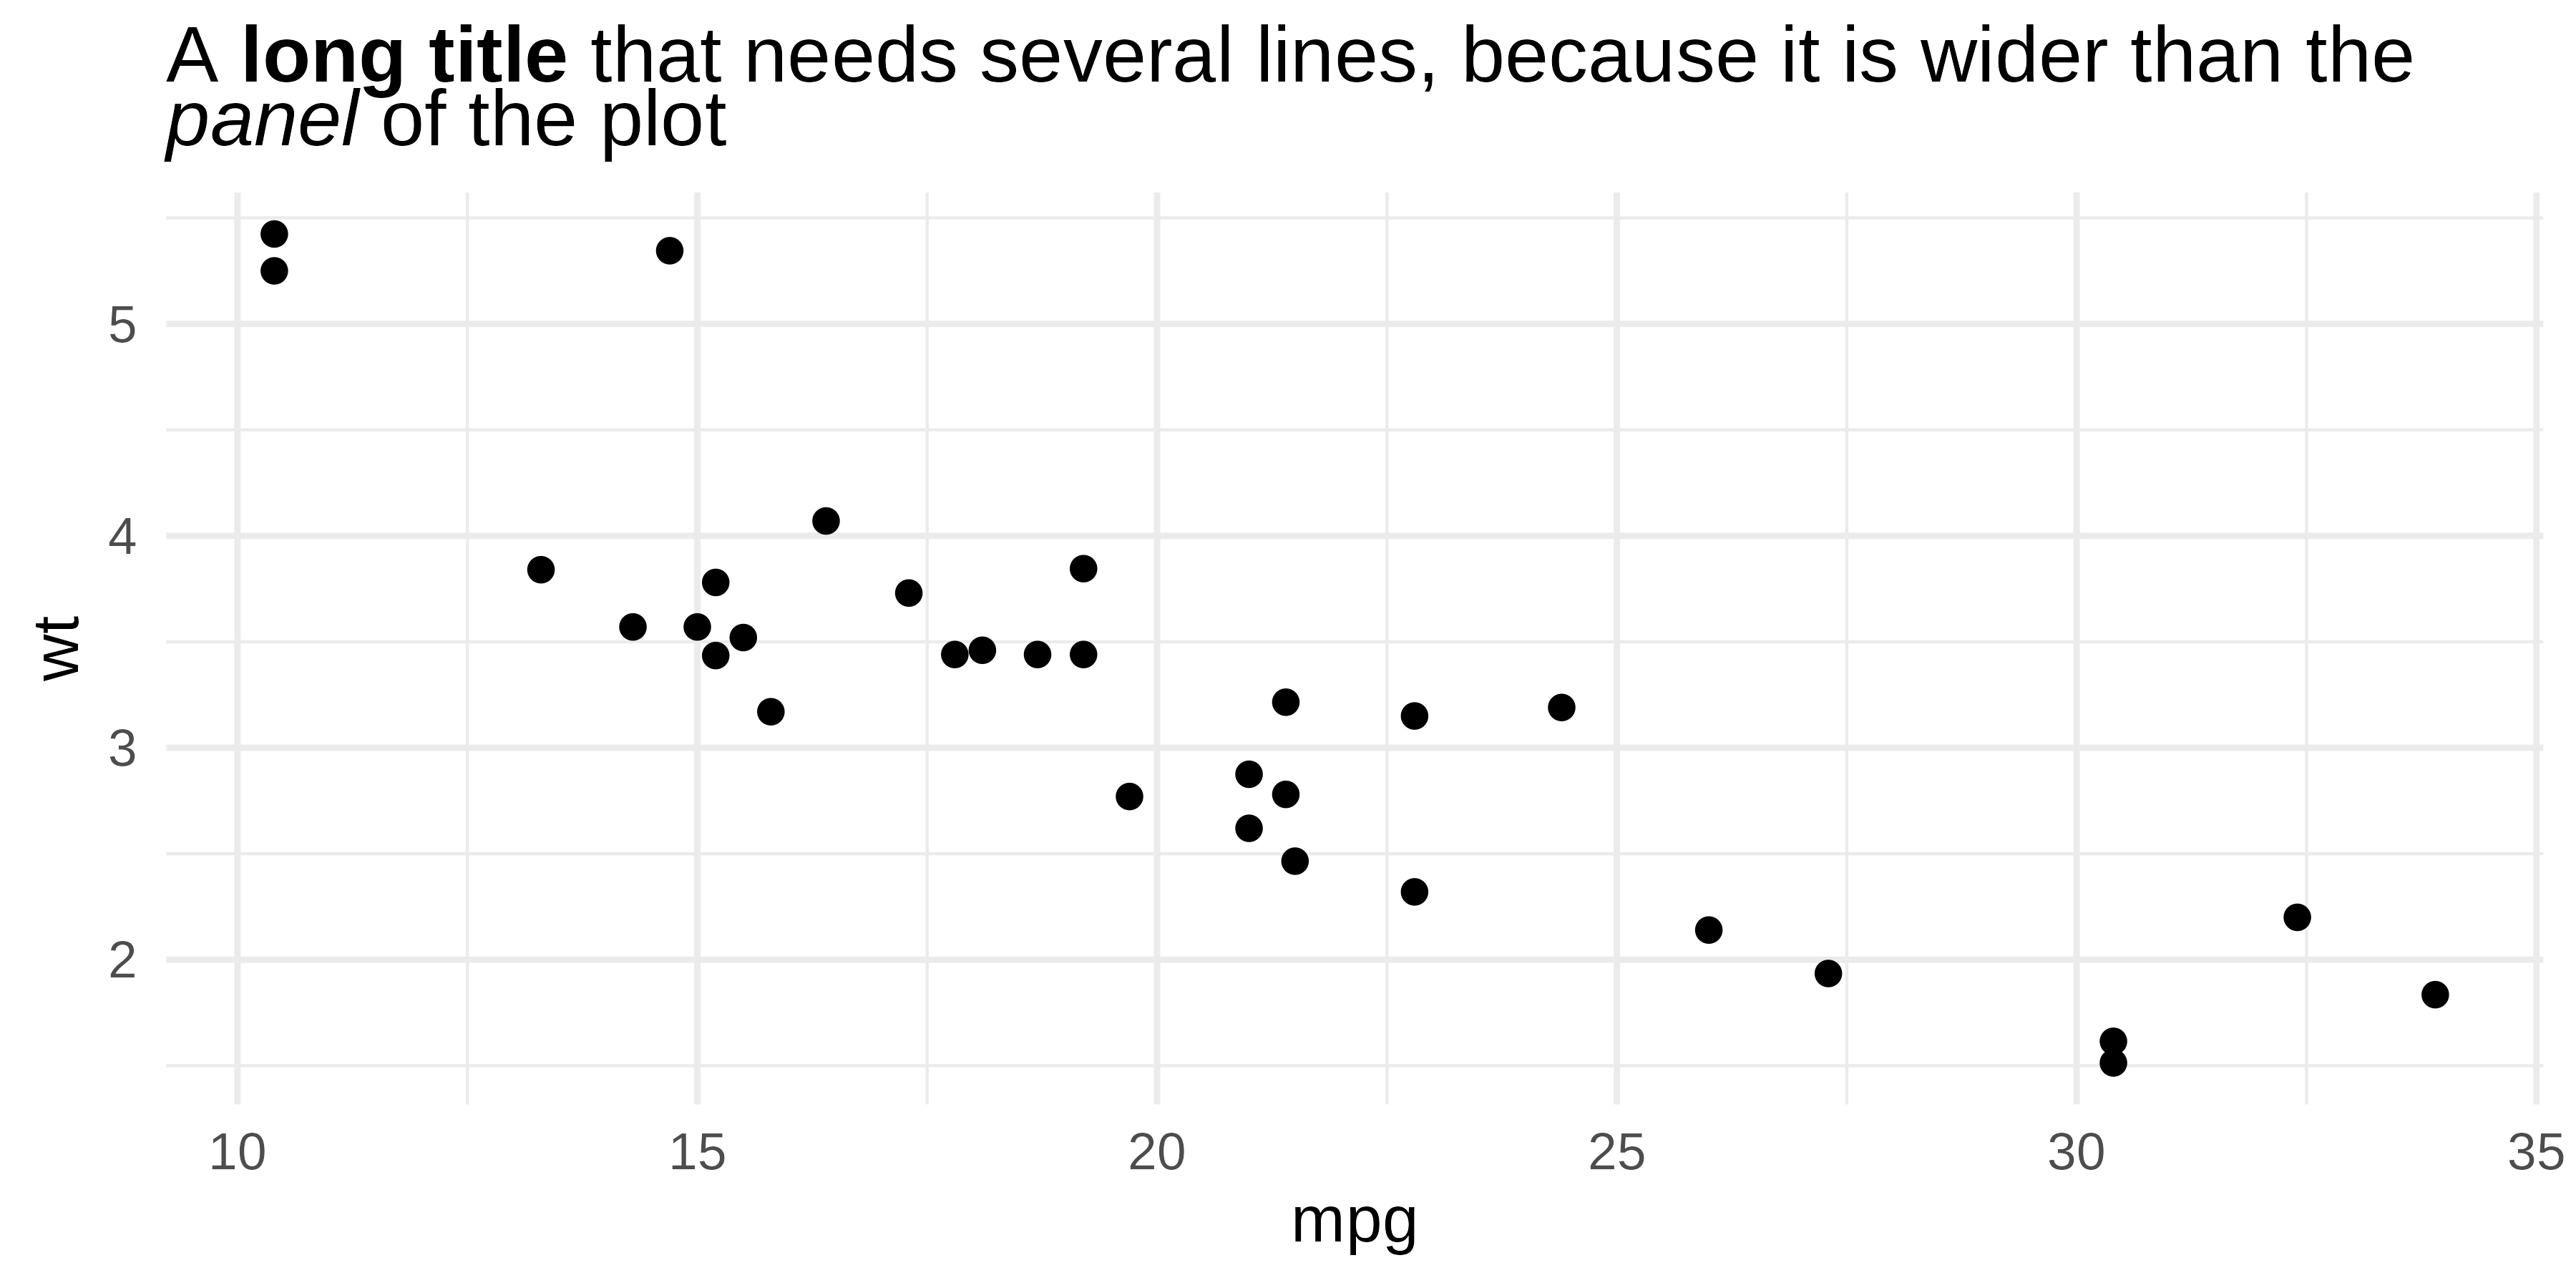
With ‘patchwork’, or with a fixed aspect ratio such as
coord_fixed(), this width is not known when the height of
the title is computed. The text may need more lines than the space kept
for it, and its first lines are cut. Set the maximum width of the text
with width, in inches:
library(patchwork)

p <- p + theme(plot.title = element_md(width = 2.5))
p | p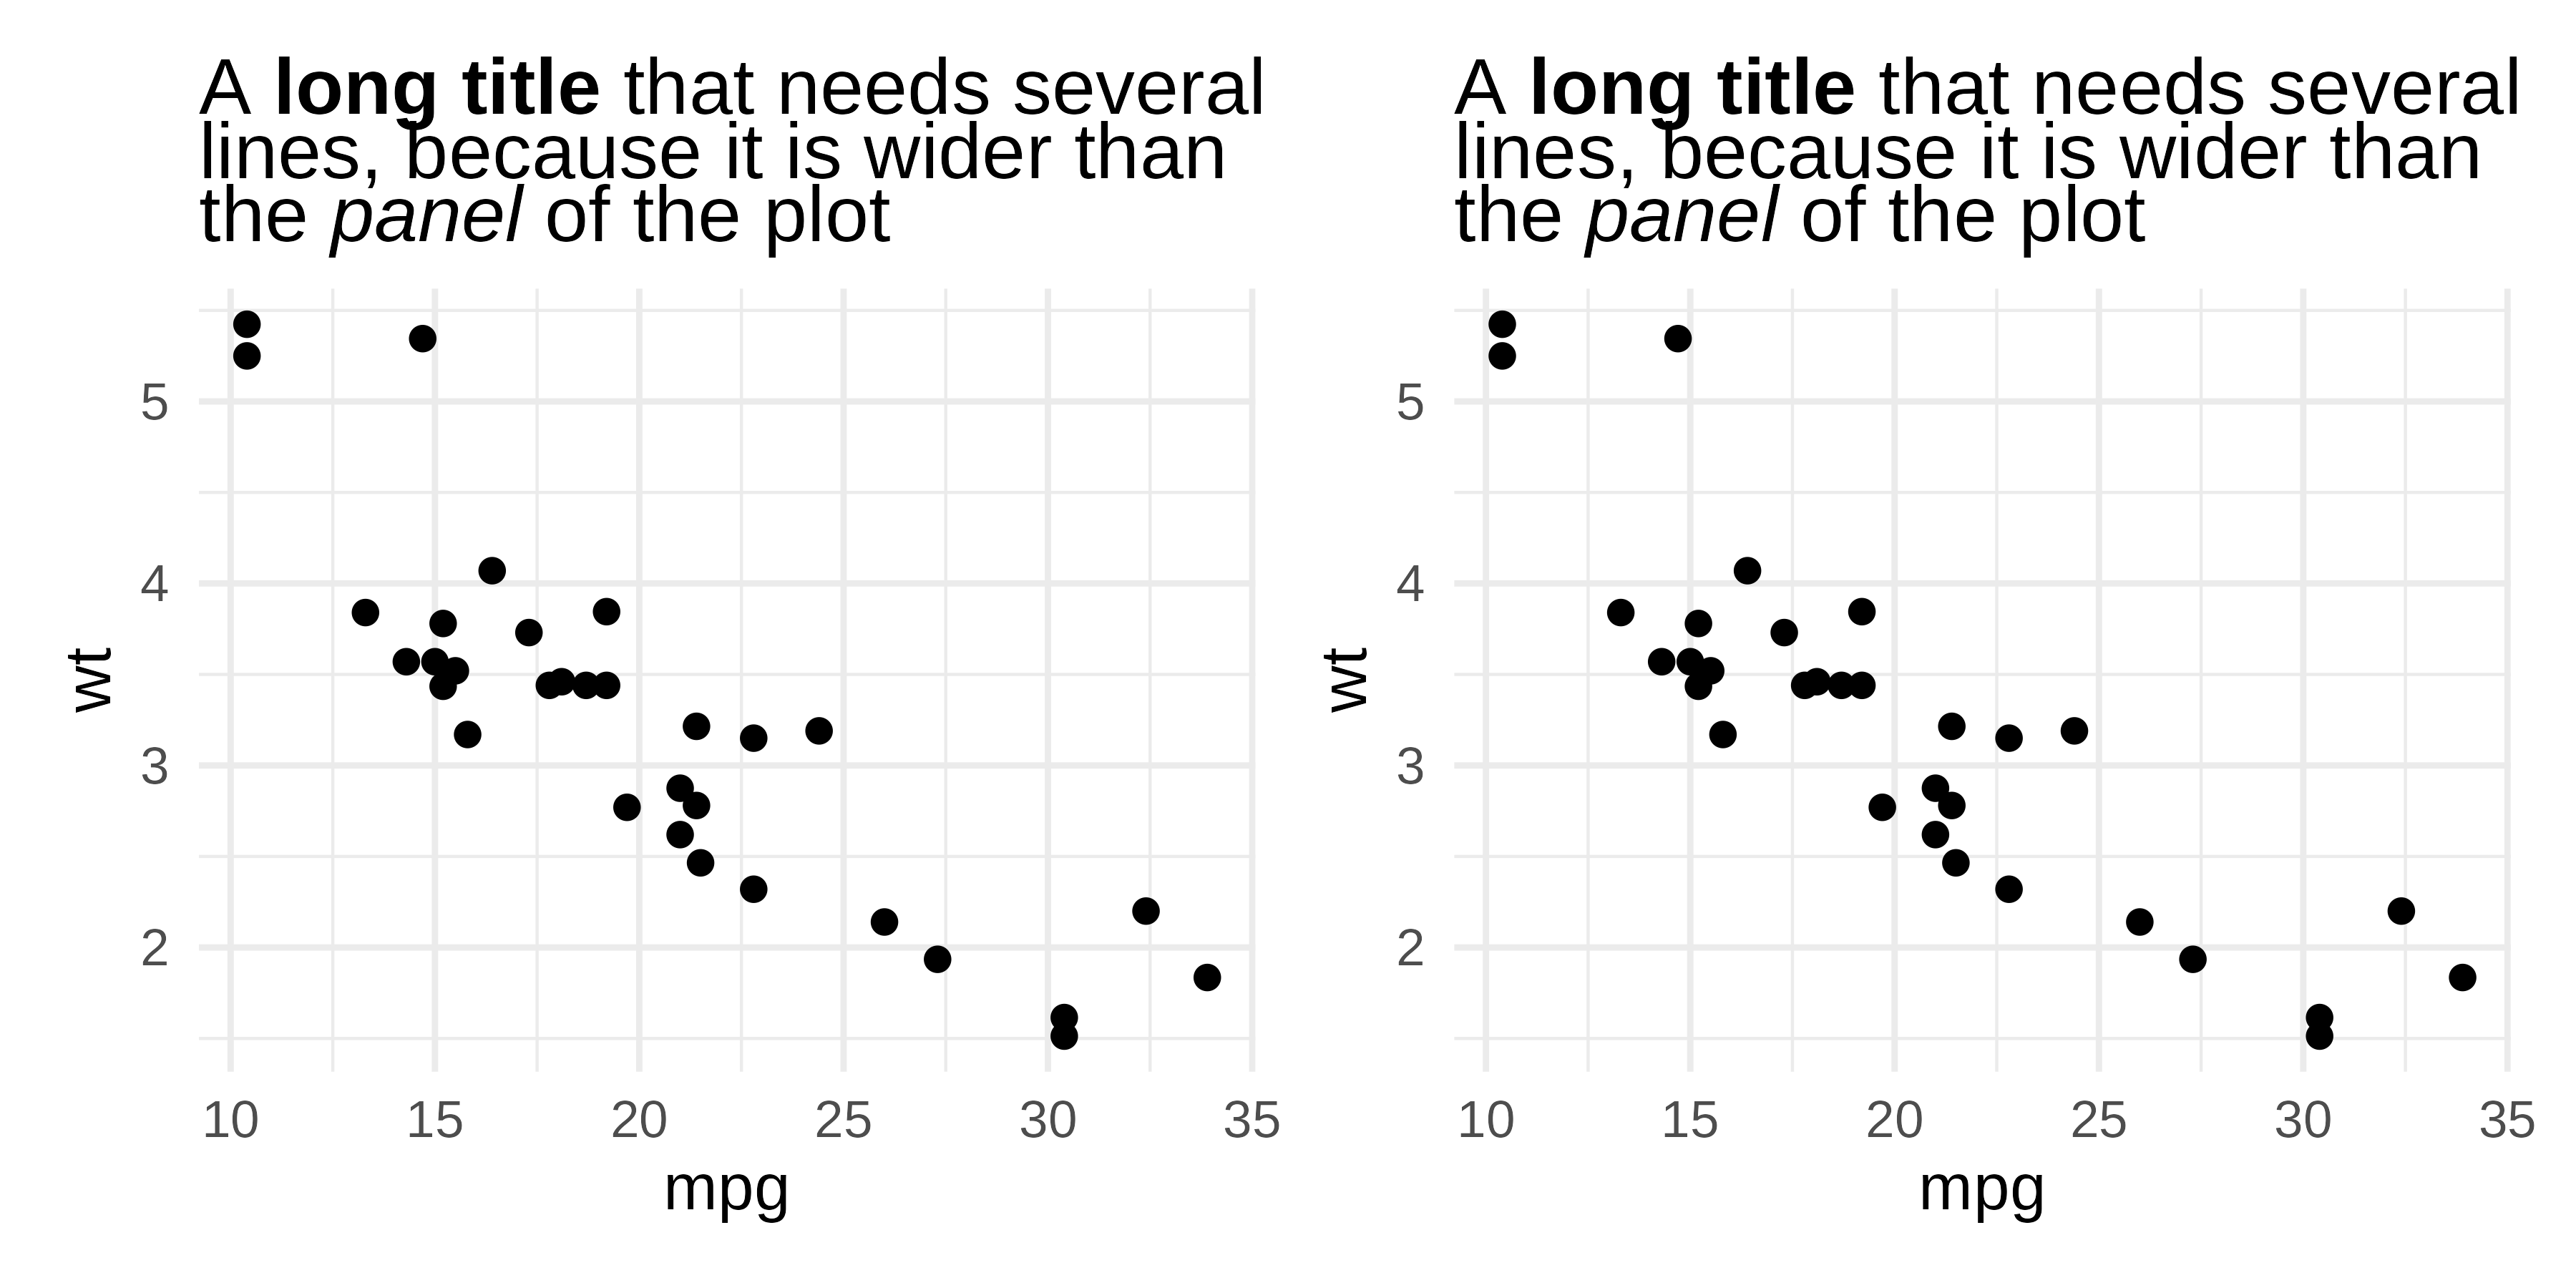
Advanced formatting with element_chunks()
element_chunks() uses ‘flextable’ formatting functions
(as_paragraph(), as_chunk(), etc.) to build
rich text with superscripts, subscripts, colors, and highlighting,
features that markdown does not support.
The as_paragraph() vocabulary
Build text by combining chunks inside
as_paragraph():
| Function | Description | Example |
|---|---|---|
as_chunk() |
Plain text | as_chunk("text") |
as_b() |
Bold | as_b("bold") |
as_i() |
Italic | as_i("italic") |
as_sup() |
Superscript | as_sup("2") |
as_sub() |
Subscript | as_sub("2") |
colorize() |
Colored text | colorize(as_chunk("red"), color = "red") |
as_highlight() |
Highlighted | as_highlight(as_chunk("text"), color = "yellow") |
chunks <- as_paragraph(
  as_b("Bold"), as_chunk(", "),
  as_i("italic"), as_chunk(", "),
  as_chunk("x"), as_sup("2"), as_chunk(", "),
  as_chunk("H"), as_sub("2"), as_chunk("O")
)

ggplot(mtcars, aes(mpg, wt)) +
  geom_point() +
  theme(plot.title = element_chunks(chunks))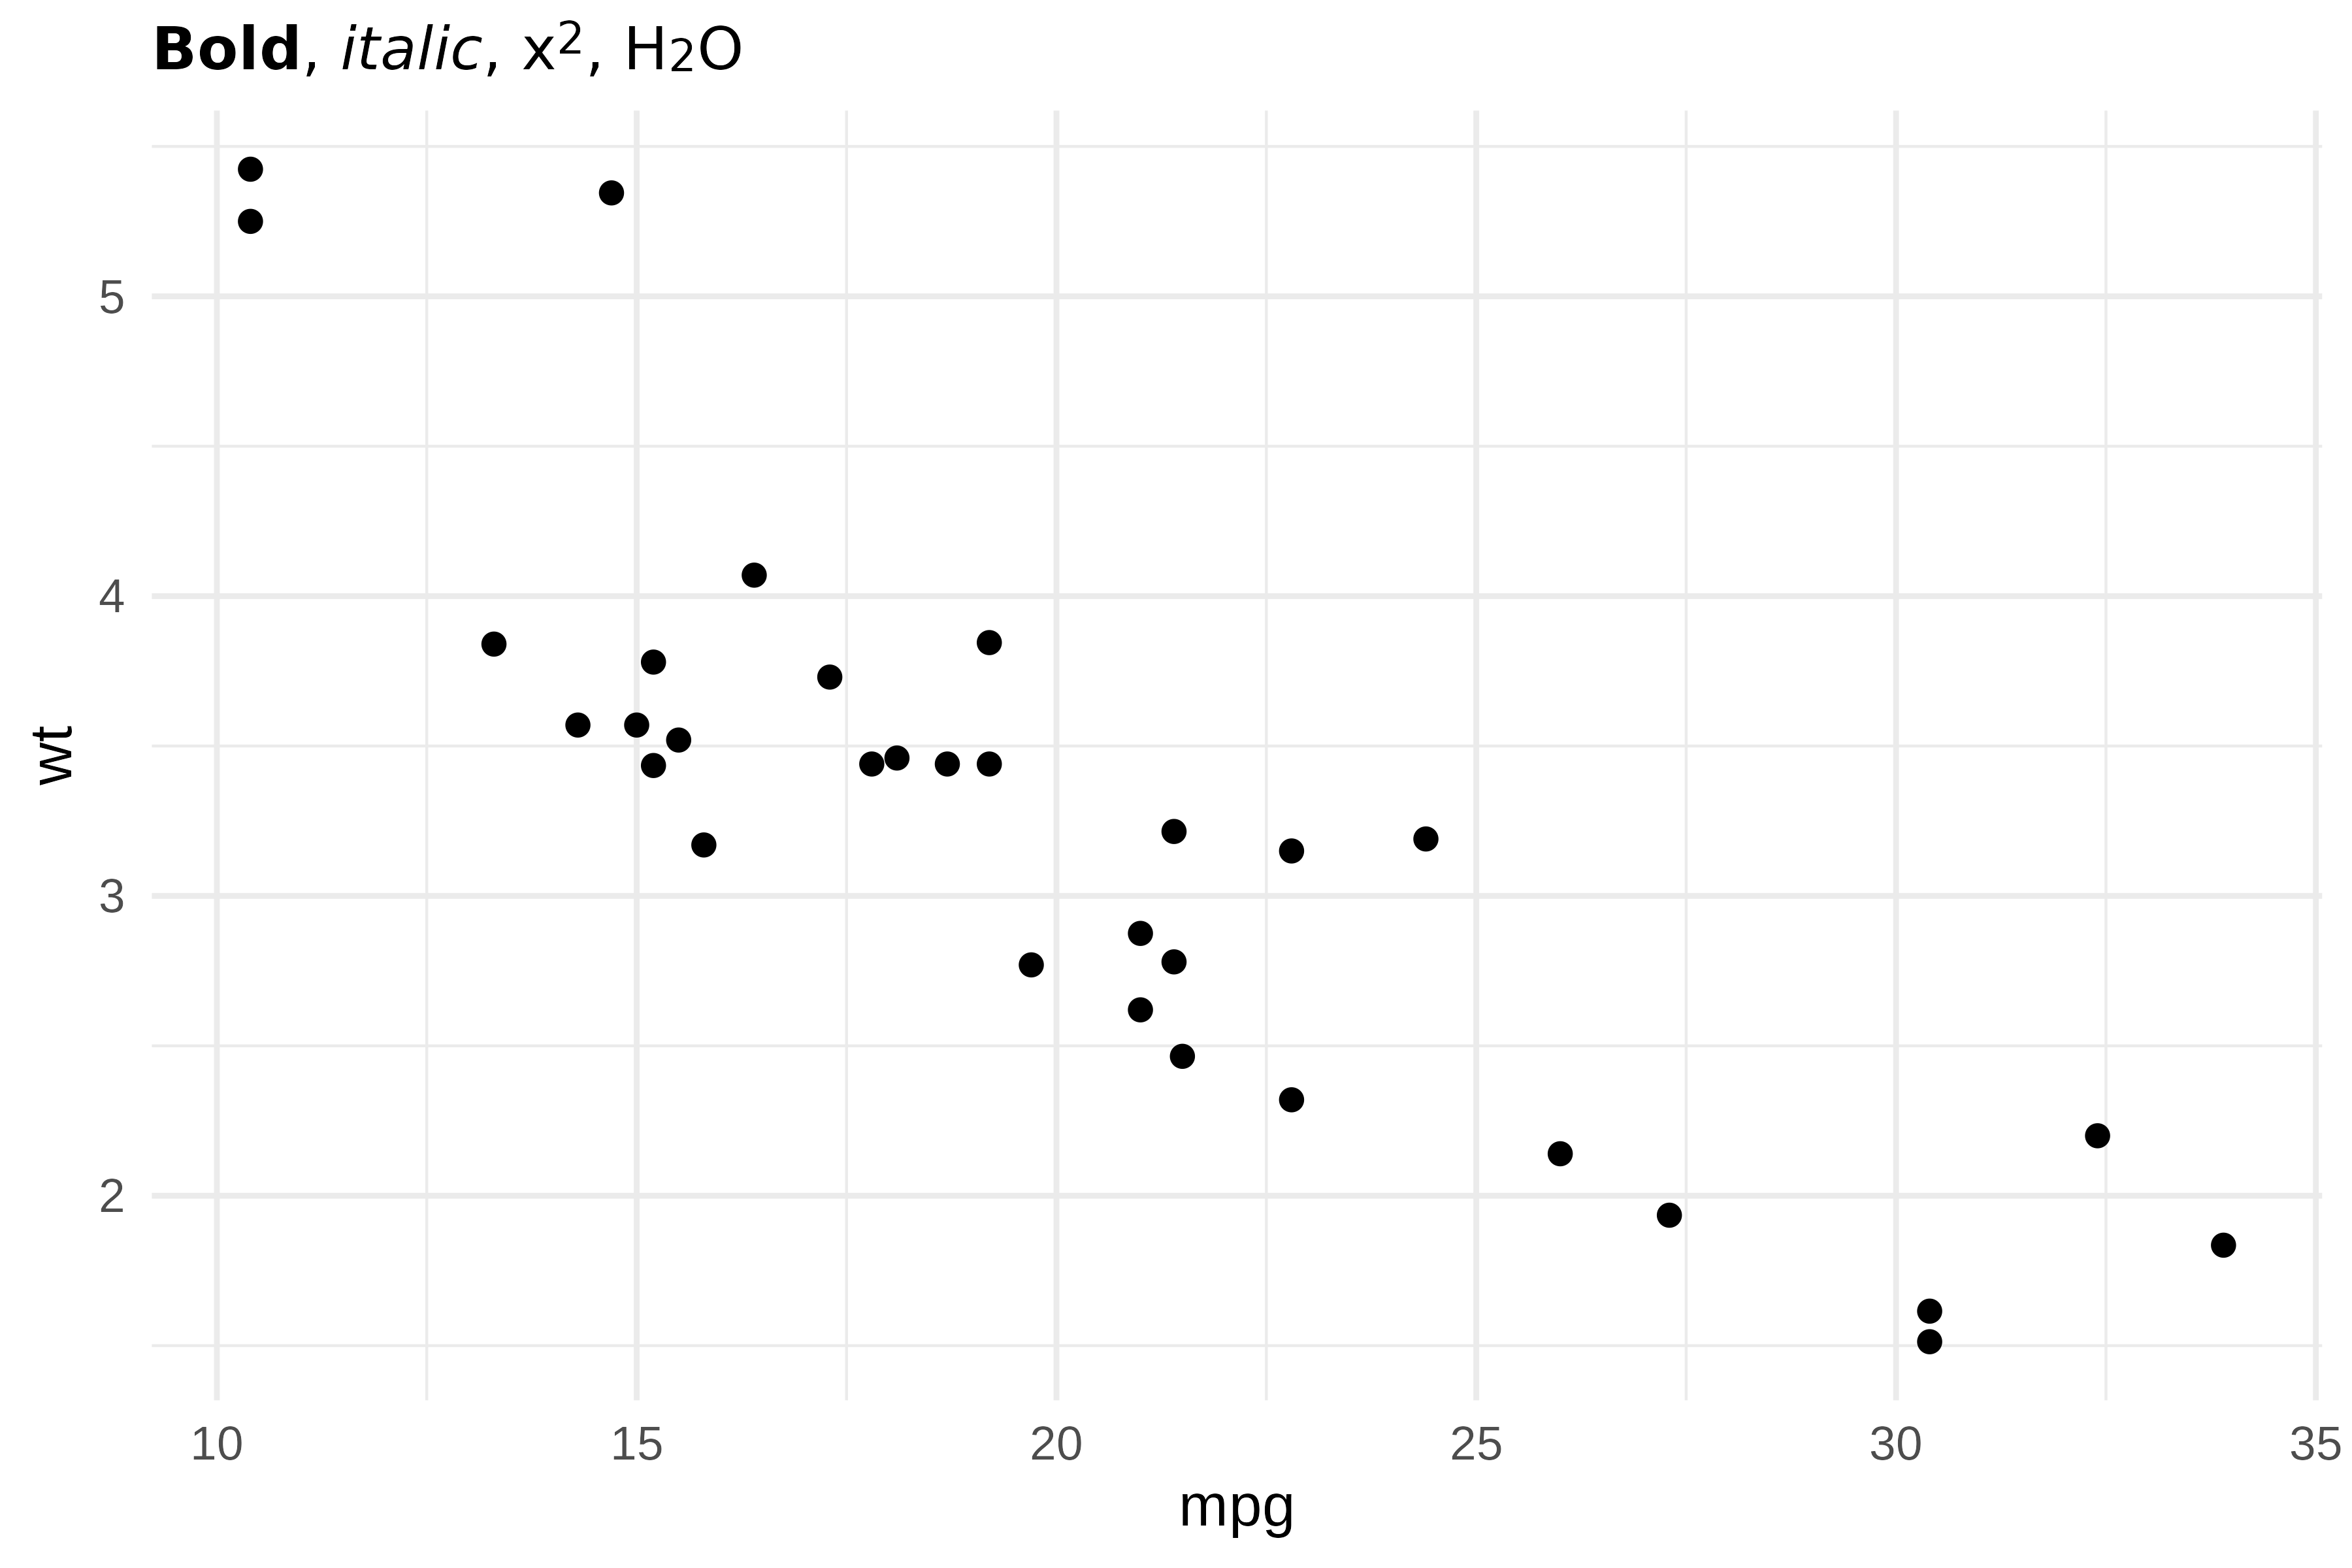
Scientific notation
Superscripts and subscripts are essential for scientific text.
element_chunks() makes them straightforward:
title_chunks <- as_paragraph(
  as_chunk("Analysis: "),
  as_b("R"), as_sup("2"),
  as_chunk(" = 0.87, "),
  as_i("p"), as_chunk(" < 0.001")
)

ggplot(mtcars, aes(mpg, wt)) +
  geom_point() +
  geom_smooth(method = "lm", se = FALSE) +
  theme(plot.title = element_chunks(title_chunks))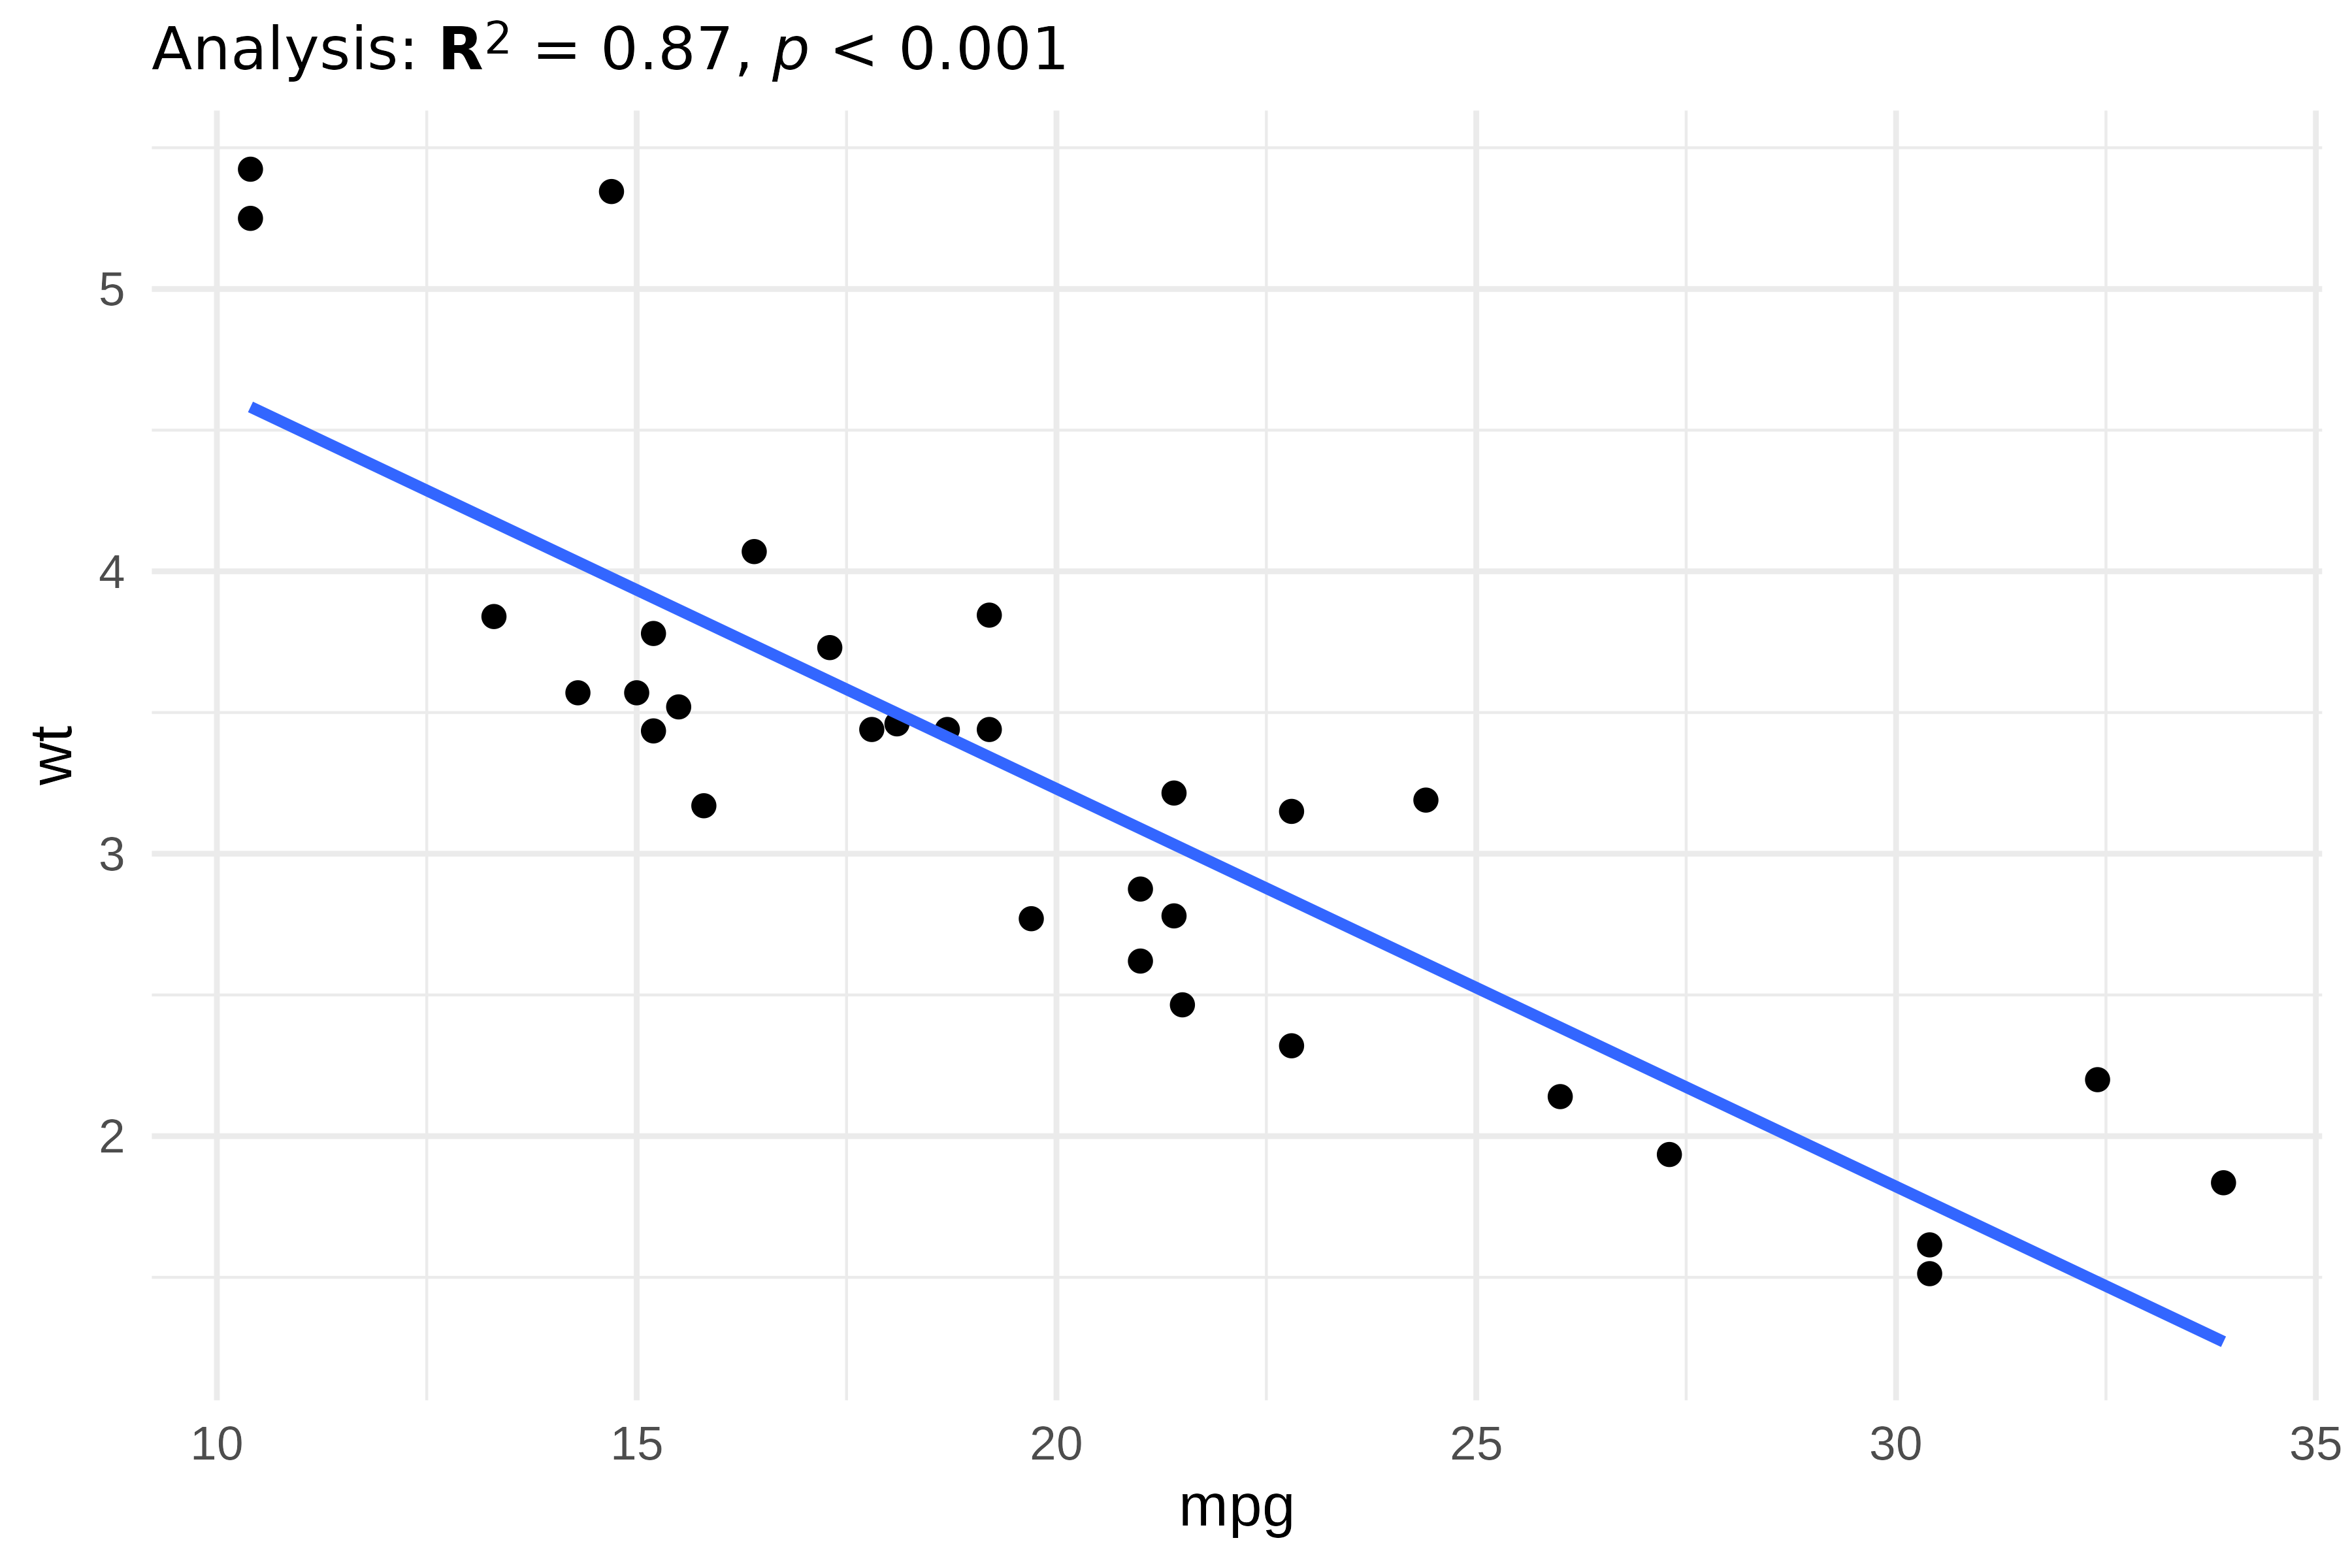
Chemical formulas:
subtitle_chunks <- as_paragraph(
  as_chunk("Concentration of "),
  as_b("H"), as_sub("2"),
  as_b("SO"), as_sub("4"),
  as_chunk(" in solution")
)

ggplot(mtcars, aes(mpg, wt)) +
  geom_point() +
  theme(plot.subtitle = element_chunks(subtitle_chunks))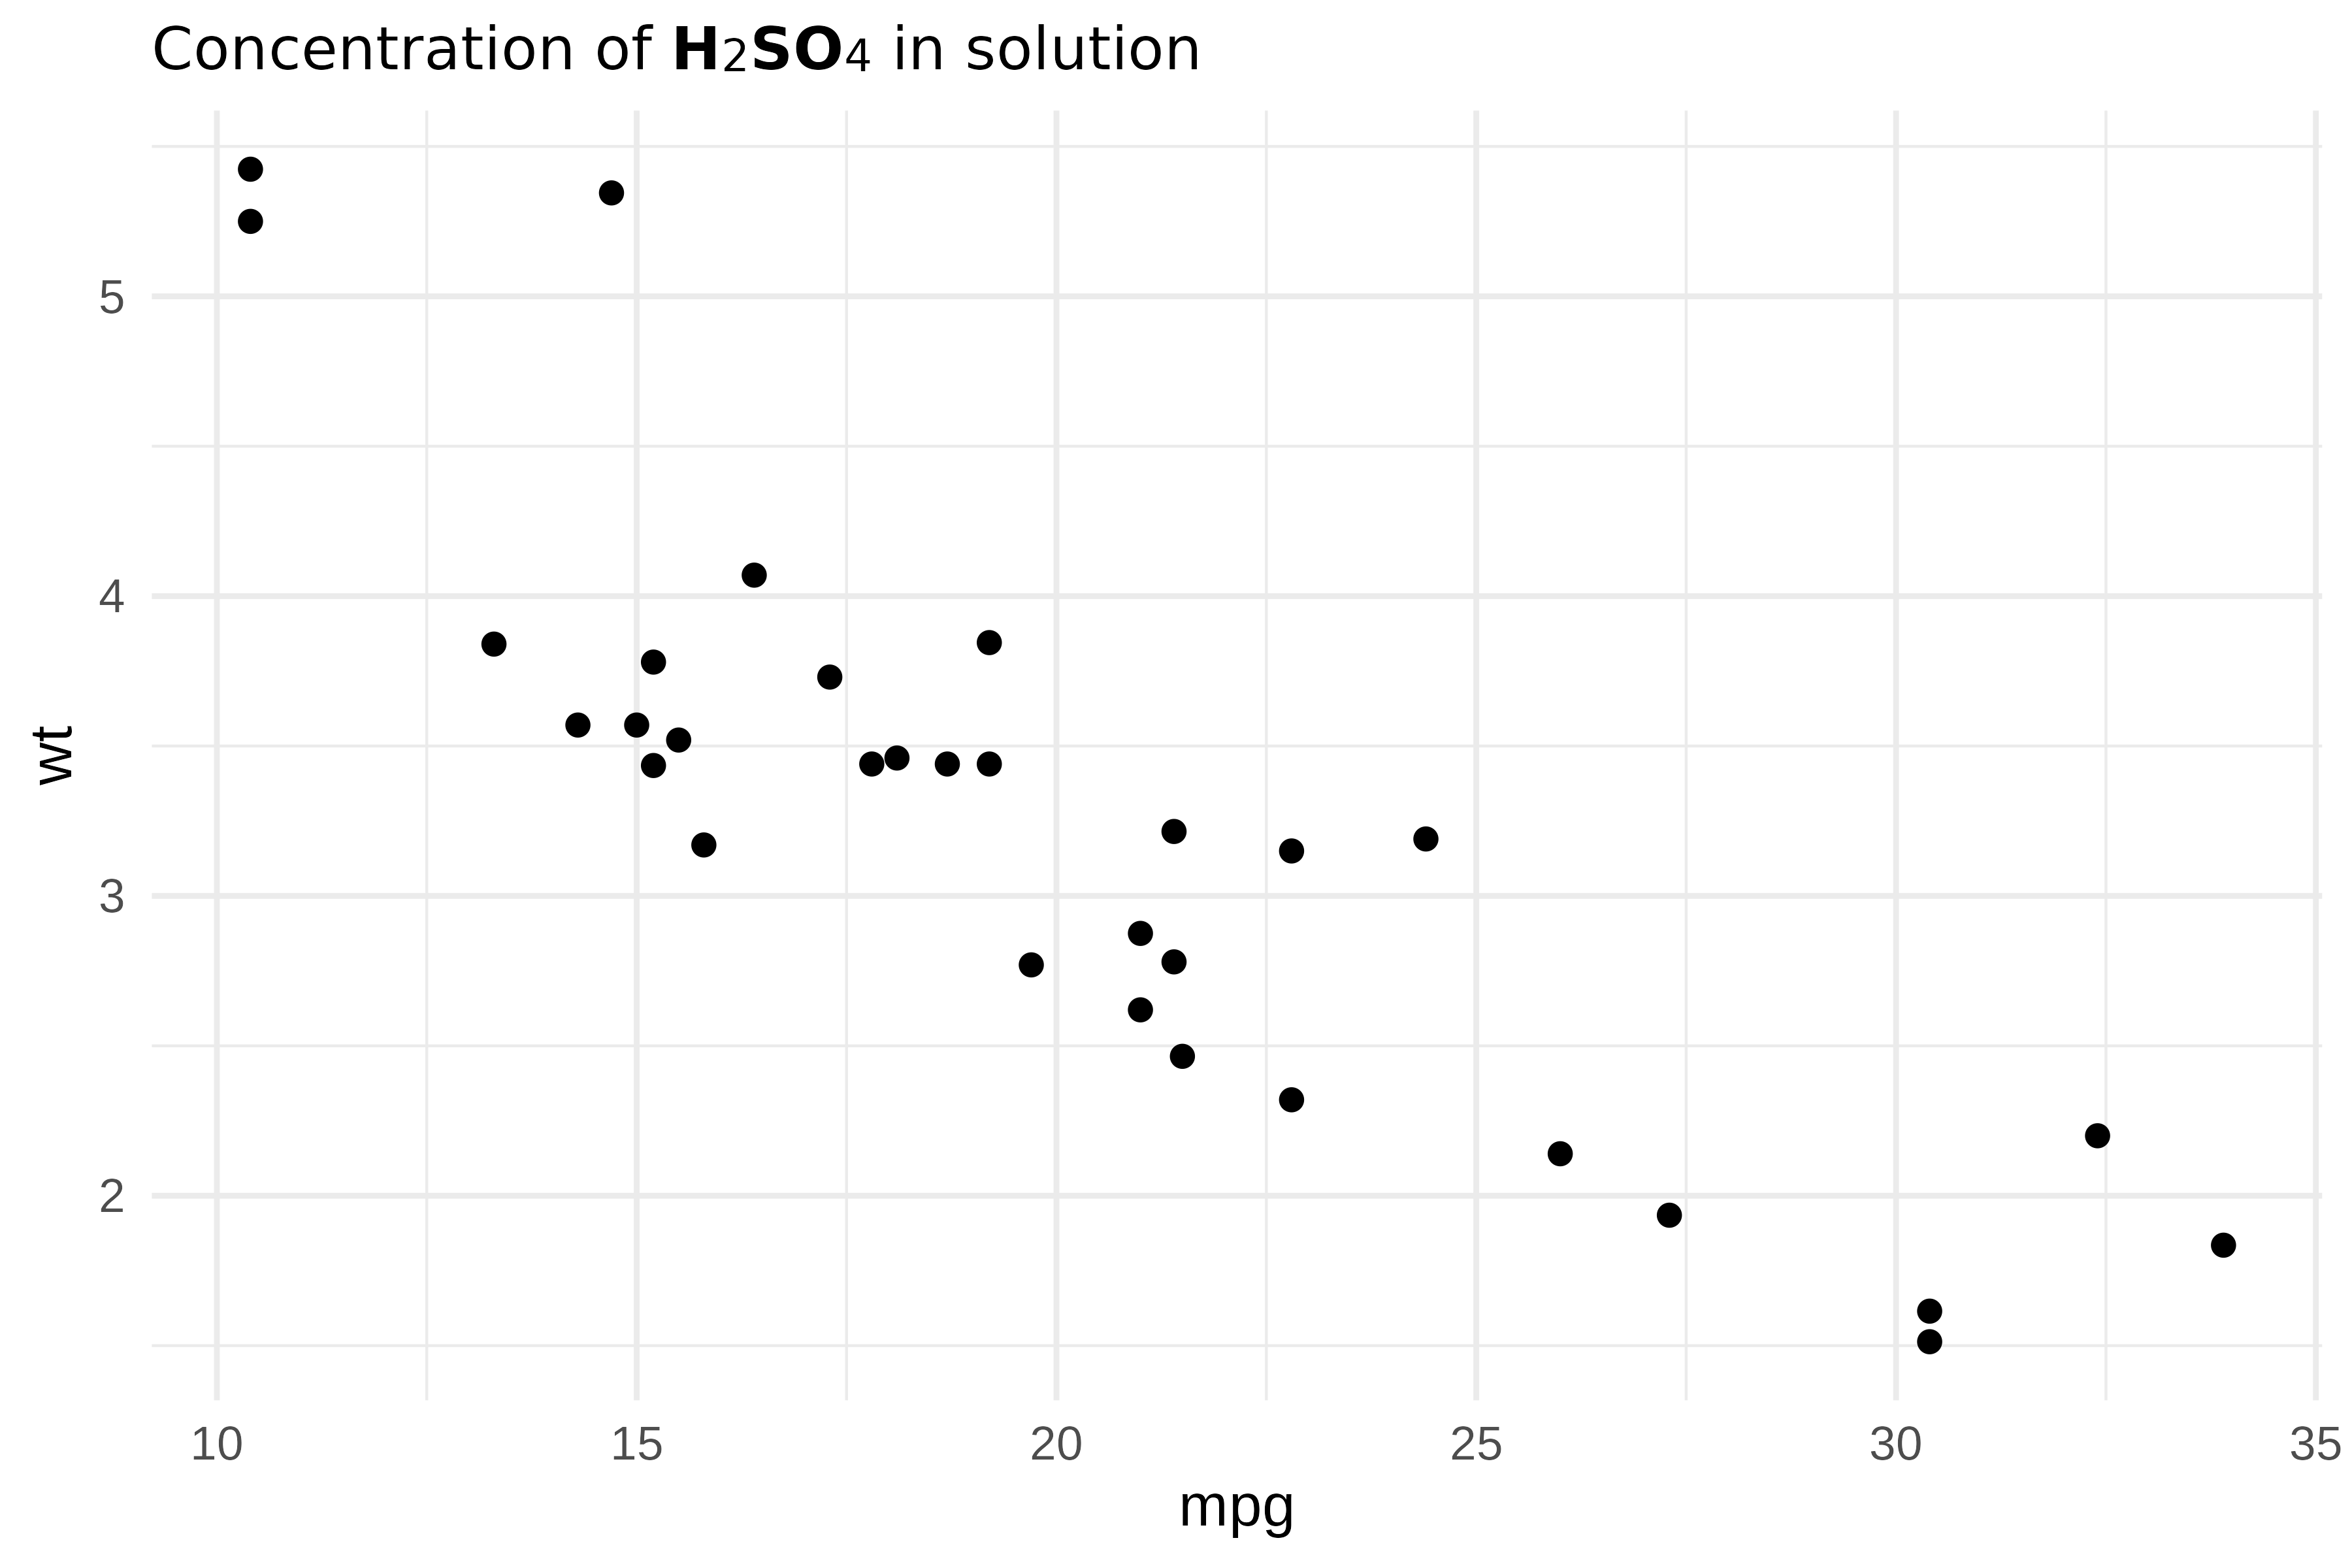
Units with exponents:
caption_chunks <- as_paragraph(
  as_chunk("Units: mol\u00B7L"), as_sup("-1"),
  as_chunk(" | Speed: m\u00B7s"), as_sup("-2")
)

ggplot(mtcars, aes(mpg, wt)) +
  geom_point() +
  theme(plot.caption = element_chunks(caption_chunks))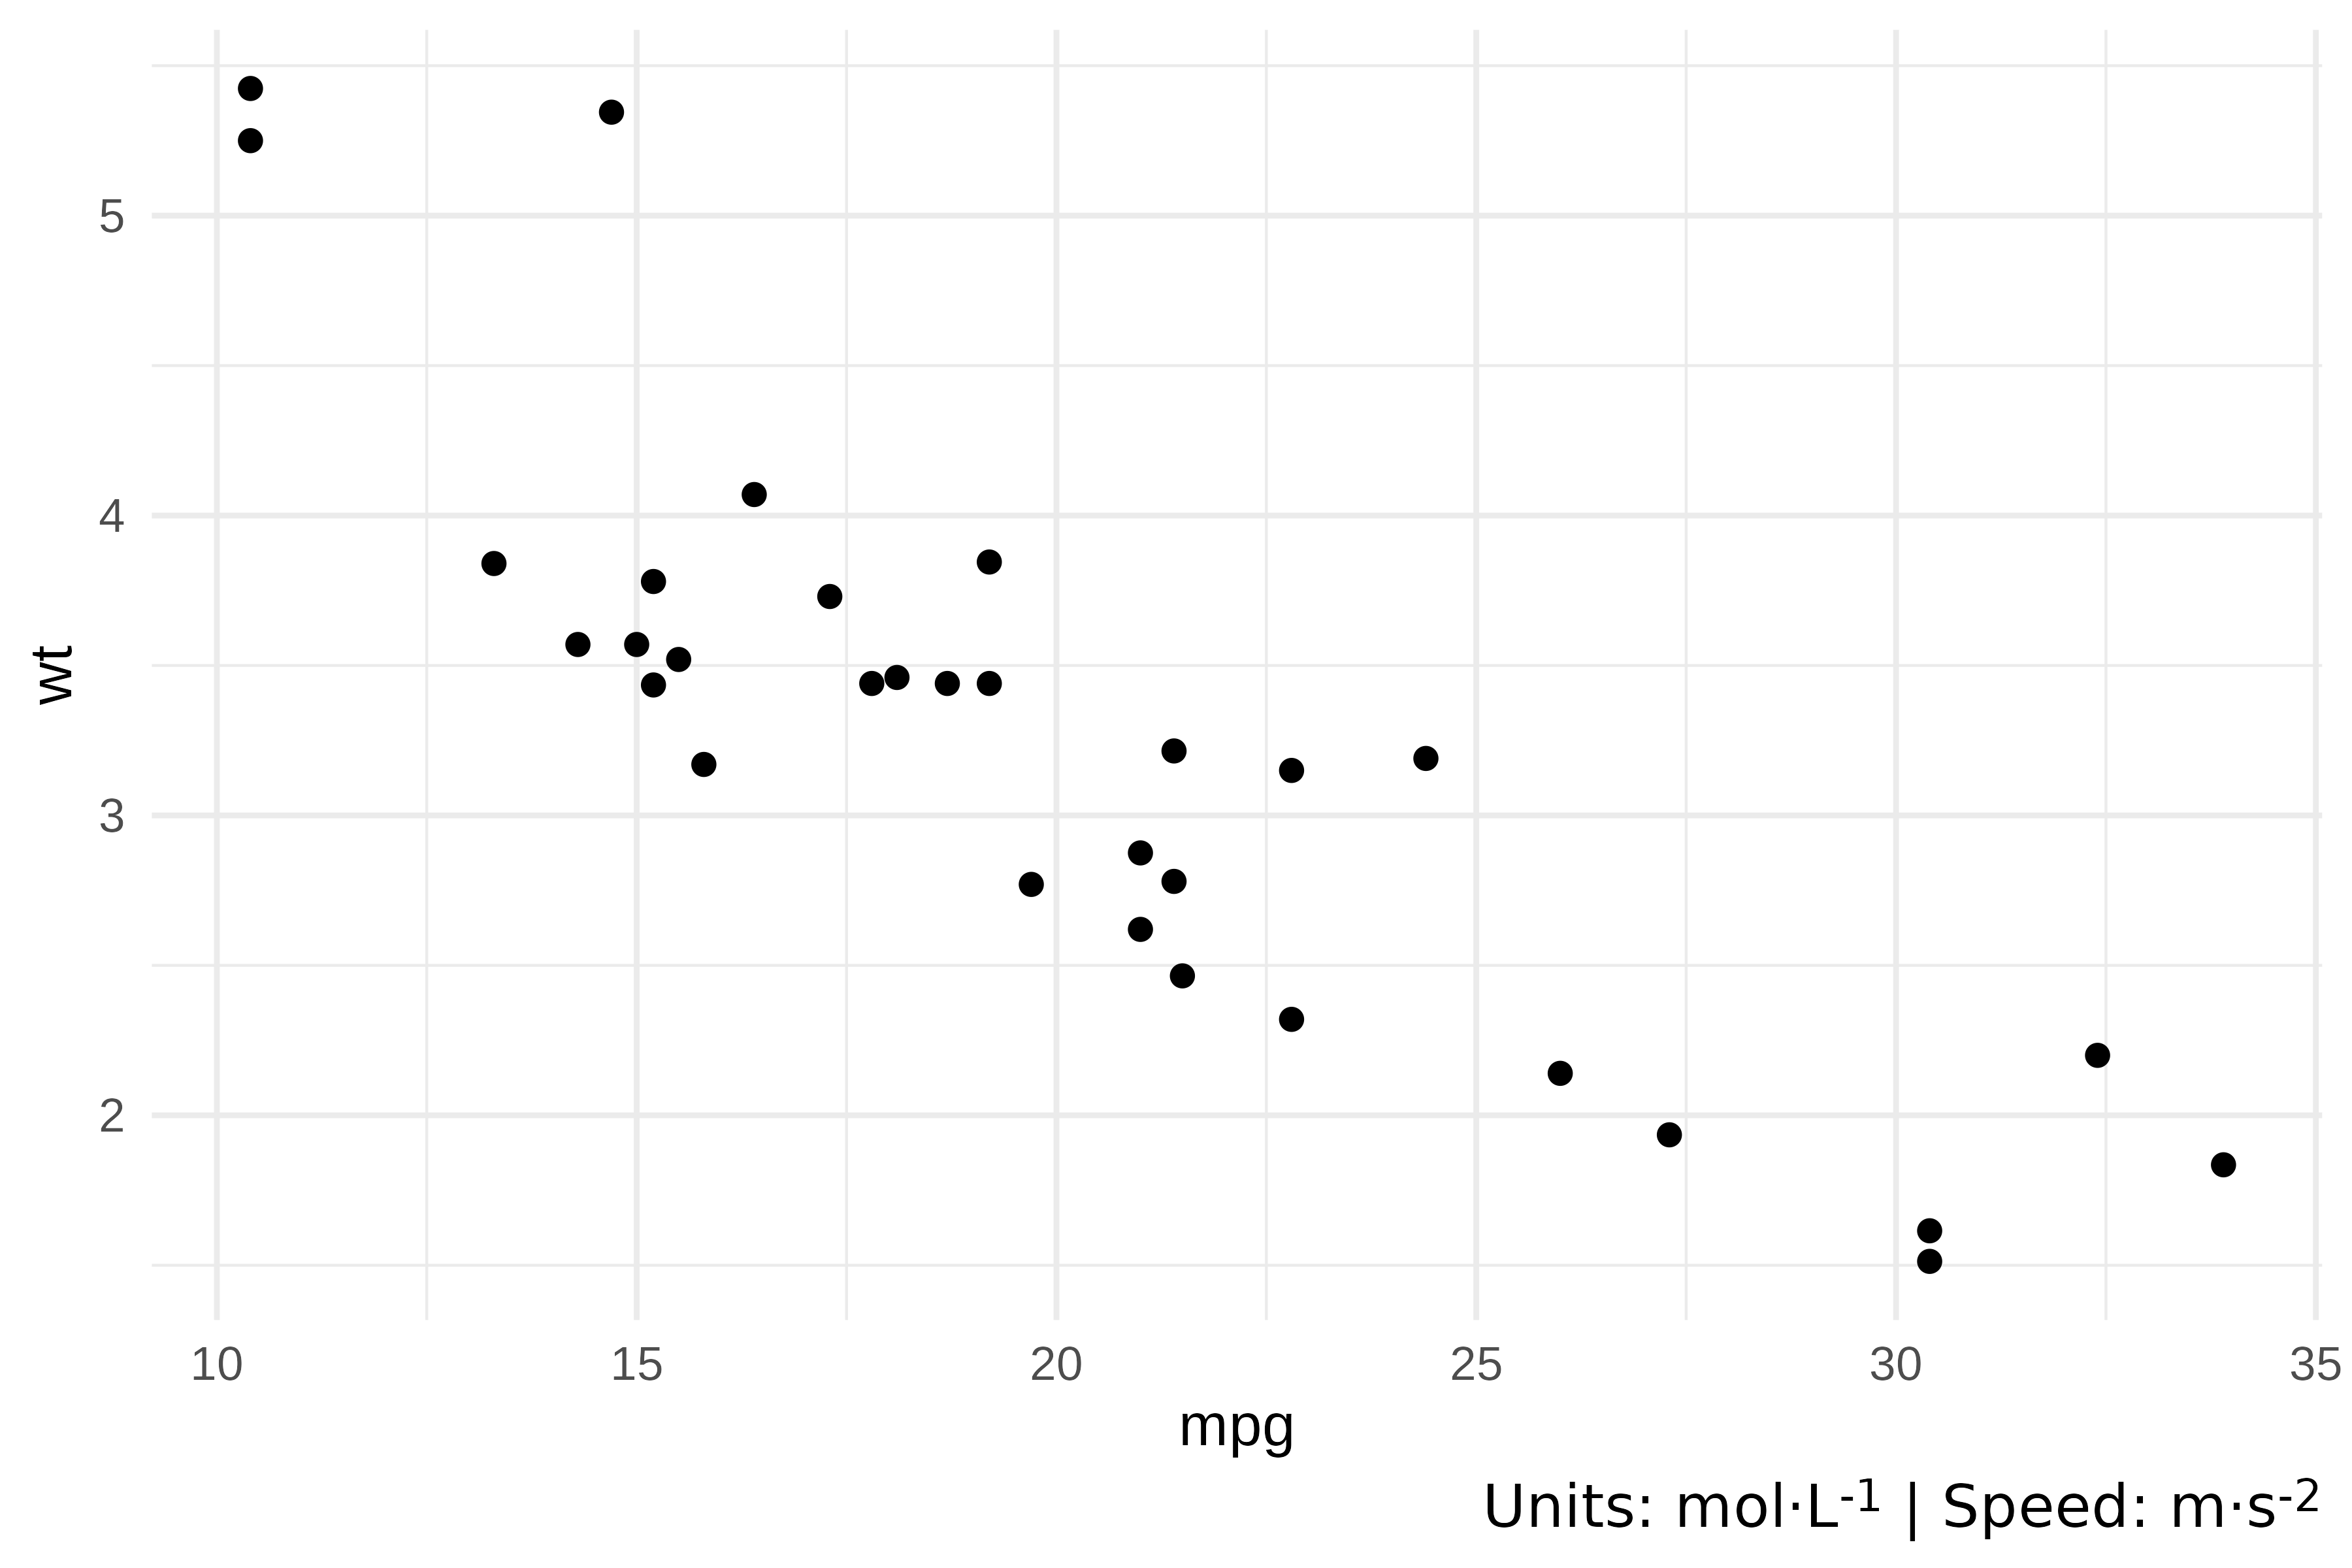
Colors and highlighting
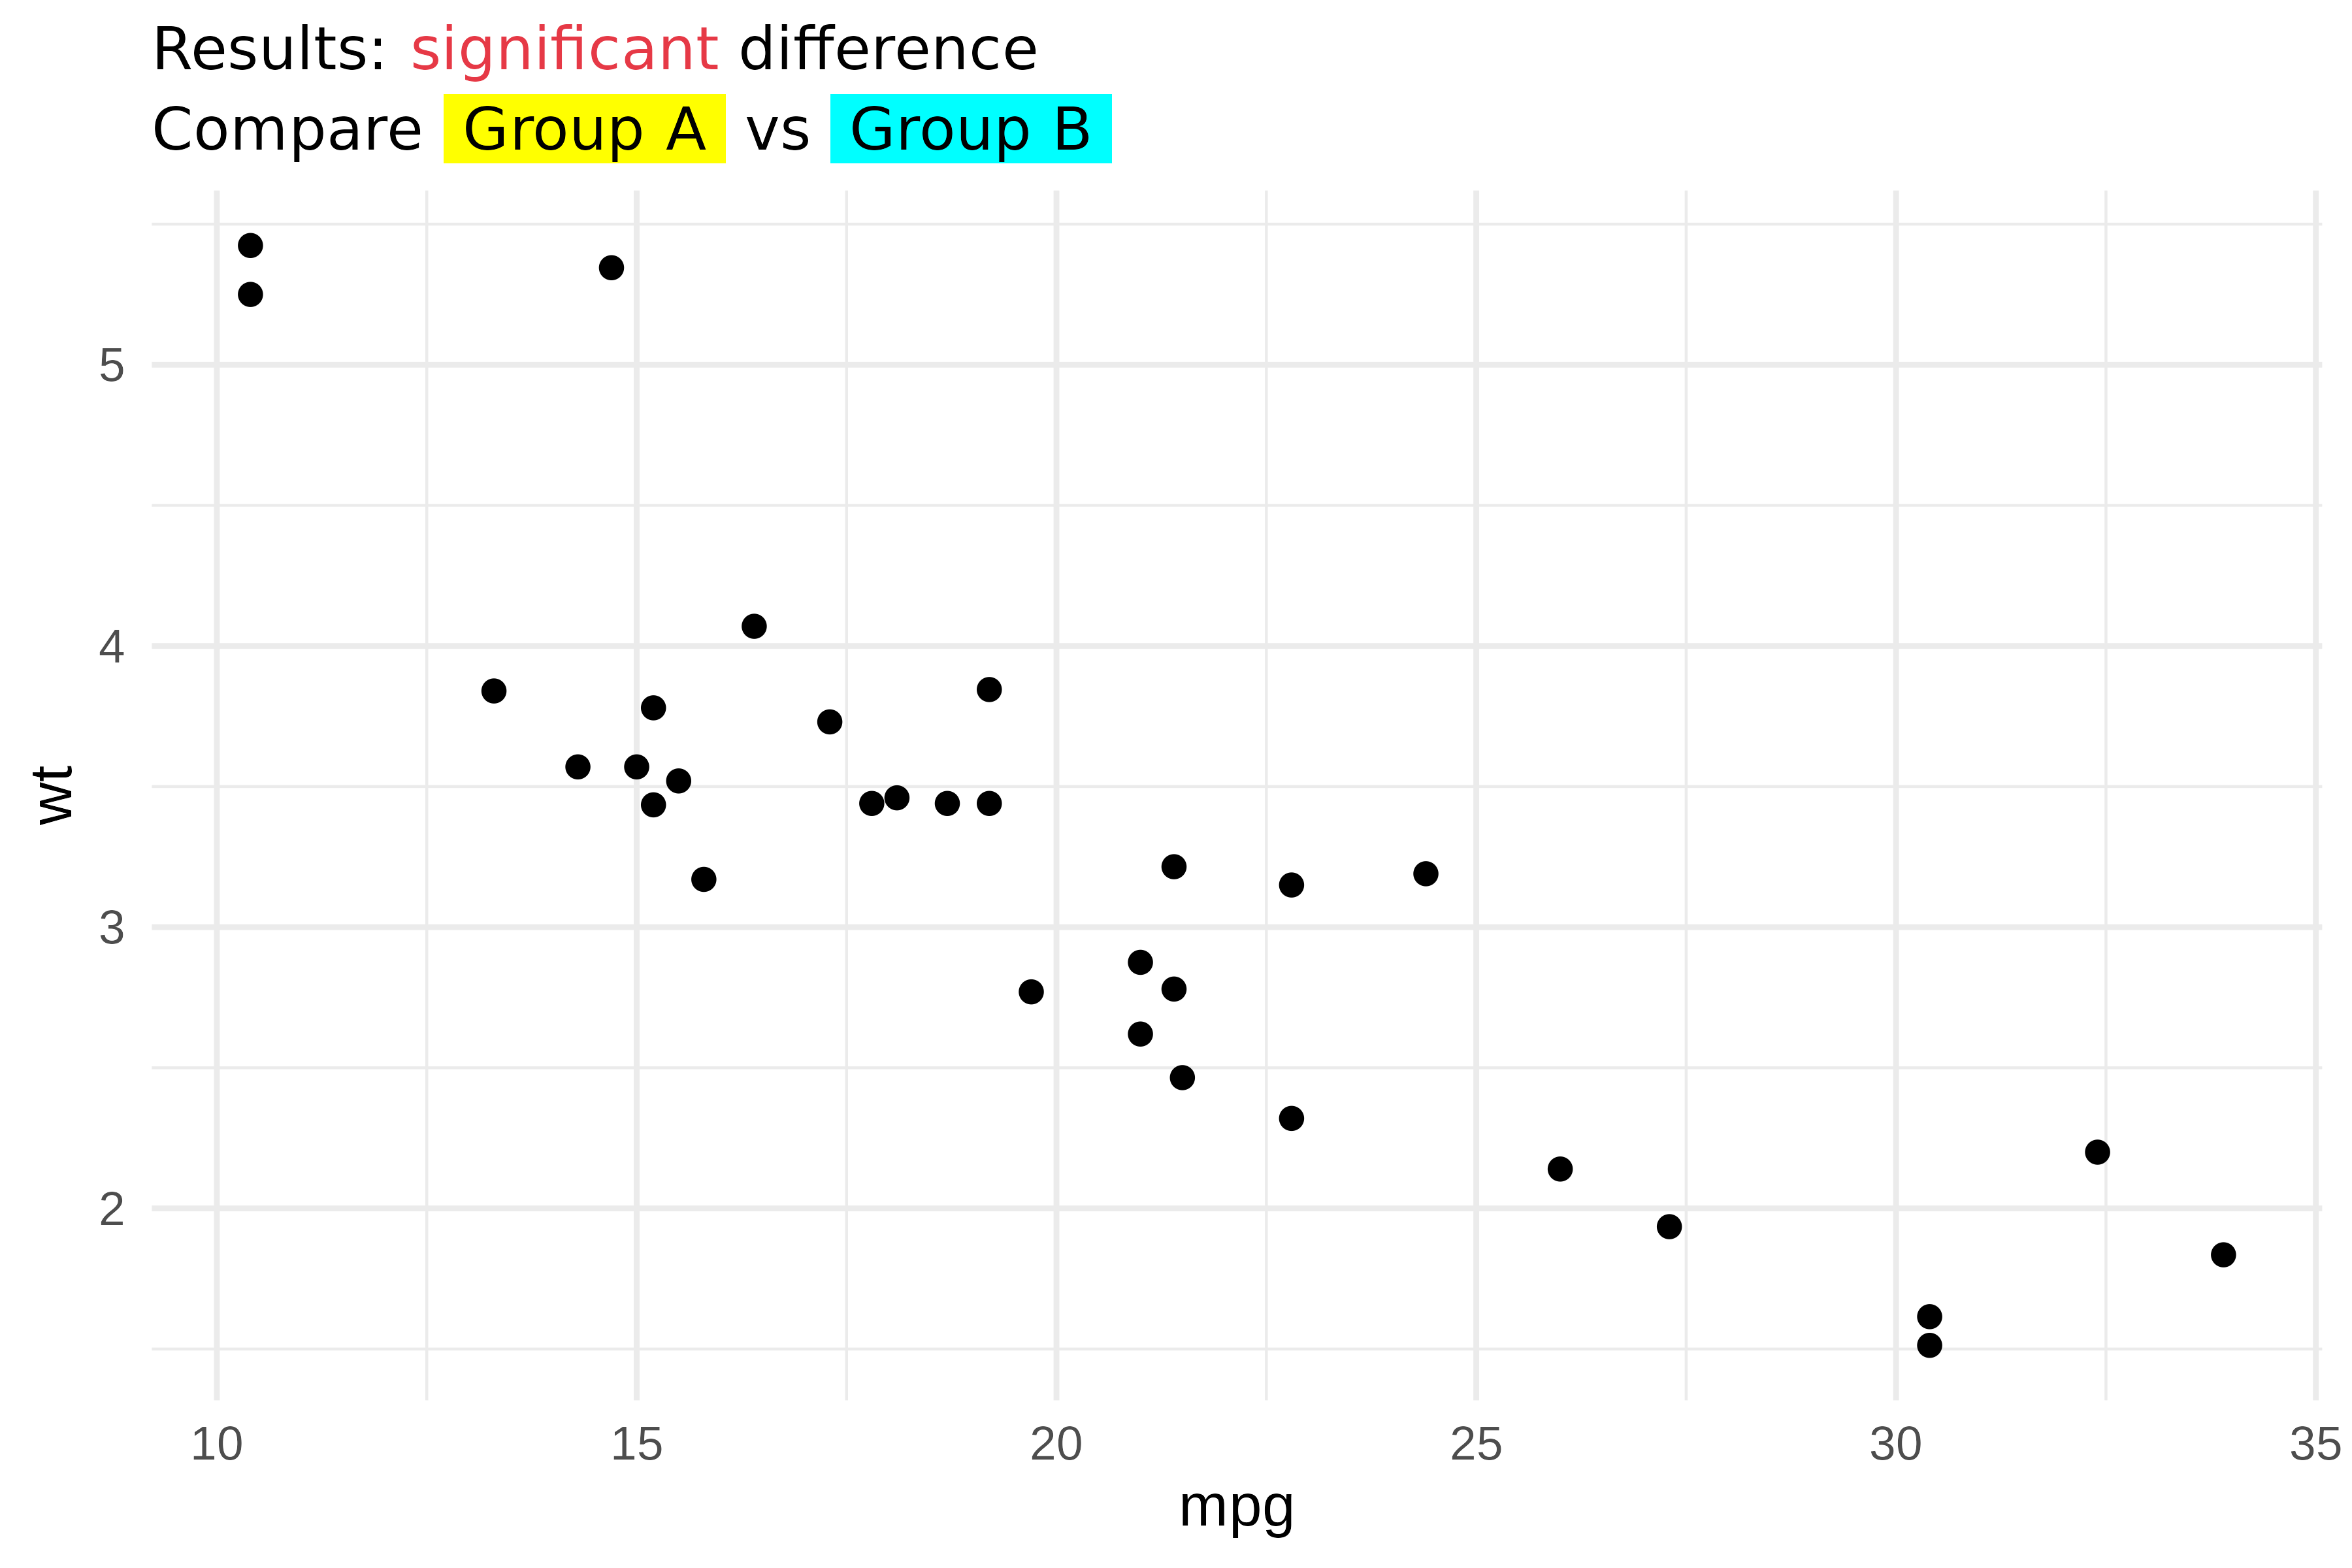
colorize() and as_highlight() add color and
background highlighting:
title_chunks <- as_paragraph(
  as_chunk("Results: "),
  colorize(as_chunk("significant"), color = "#E63946"),
  as_chunk(" difference")
)

subtitle_chunks <- as_paragraph(
  as_chunk("Compare "),
  as_highlight(as_chunk(" Group A "), color = "yellow"),
  as_chunk(" vs "),
  as_highlight(as_chunk(" Group B "), color = "cyan")
)

ggplot(mtcars, aes(mpg, wt)) +
  geom_point() +
  theme(
    plot.title = element_chunks(title_chunks),
    plot.subtitle = element_chunks(subtitle_chunks)
  )
Images in theme elements
as_image() embeds images inside
element_chunks(). This is useful for logos or icons in
titles:
r_logo <- file.path(R.home("doc"), "html", "logo.jpg")

title_chunks <- as_paragraph(
  as_image(src = r_logo, width = 0.25, height = 0.2),
  as_chunk(" "),
  as_b("R Project"),
  as_chunk(" - fuel consumption data")
)

ggplot(mtcars, aes(mpg, wt)) +
  geom_point() +
  theme(plot.title = element_chunks(title_chunks))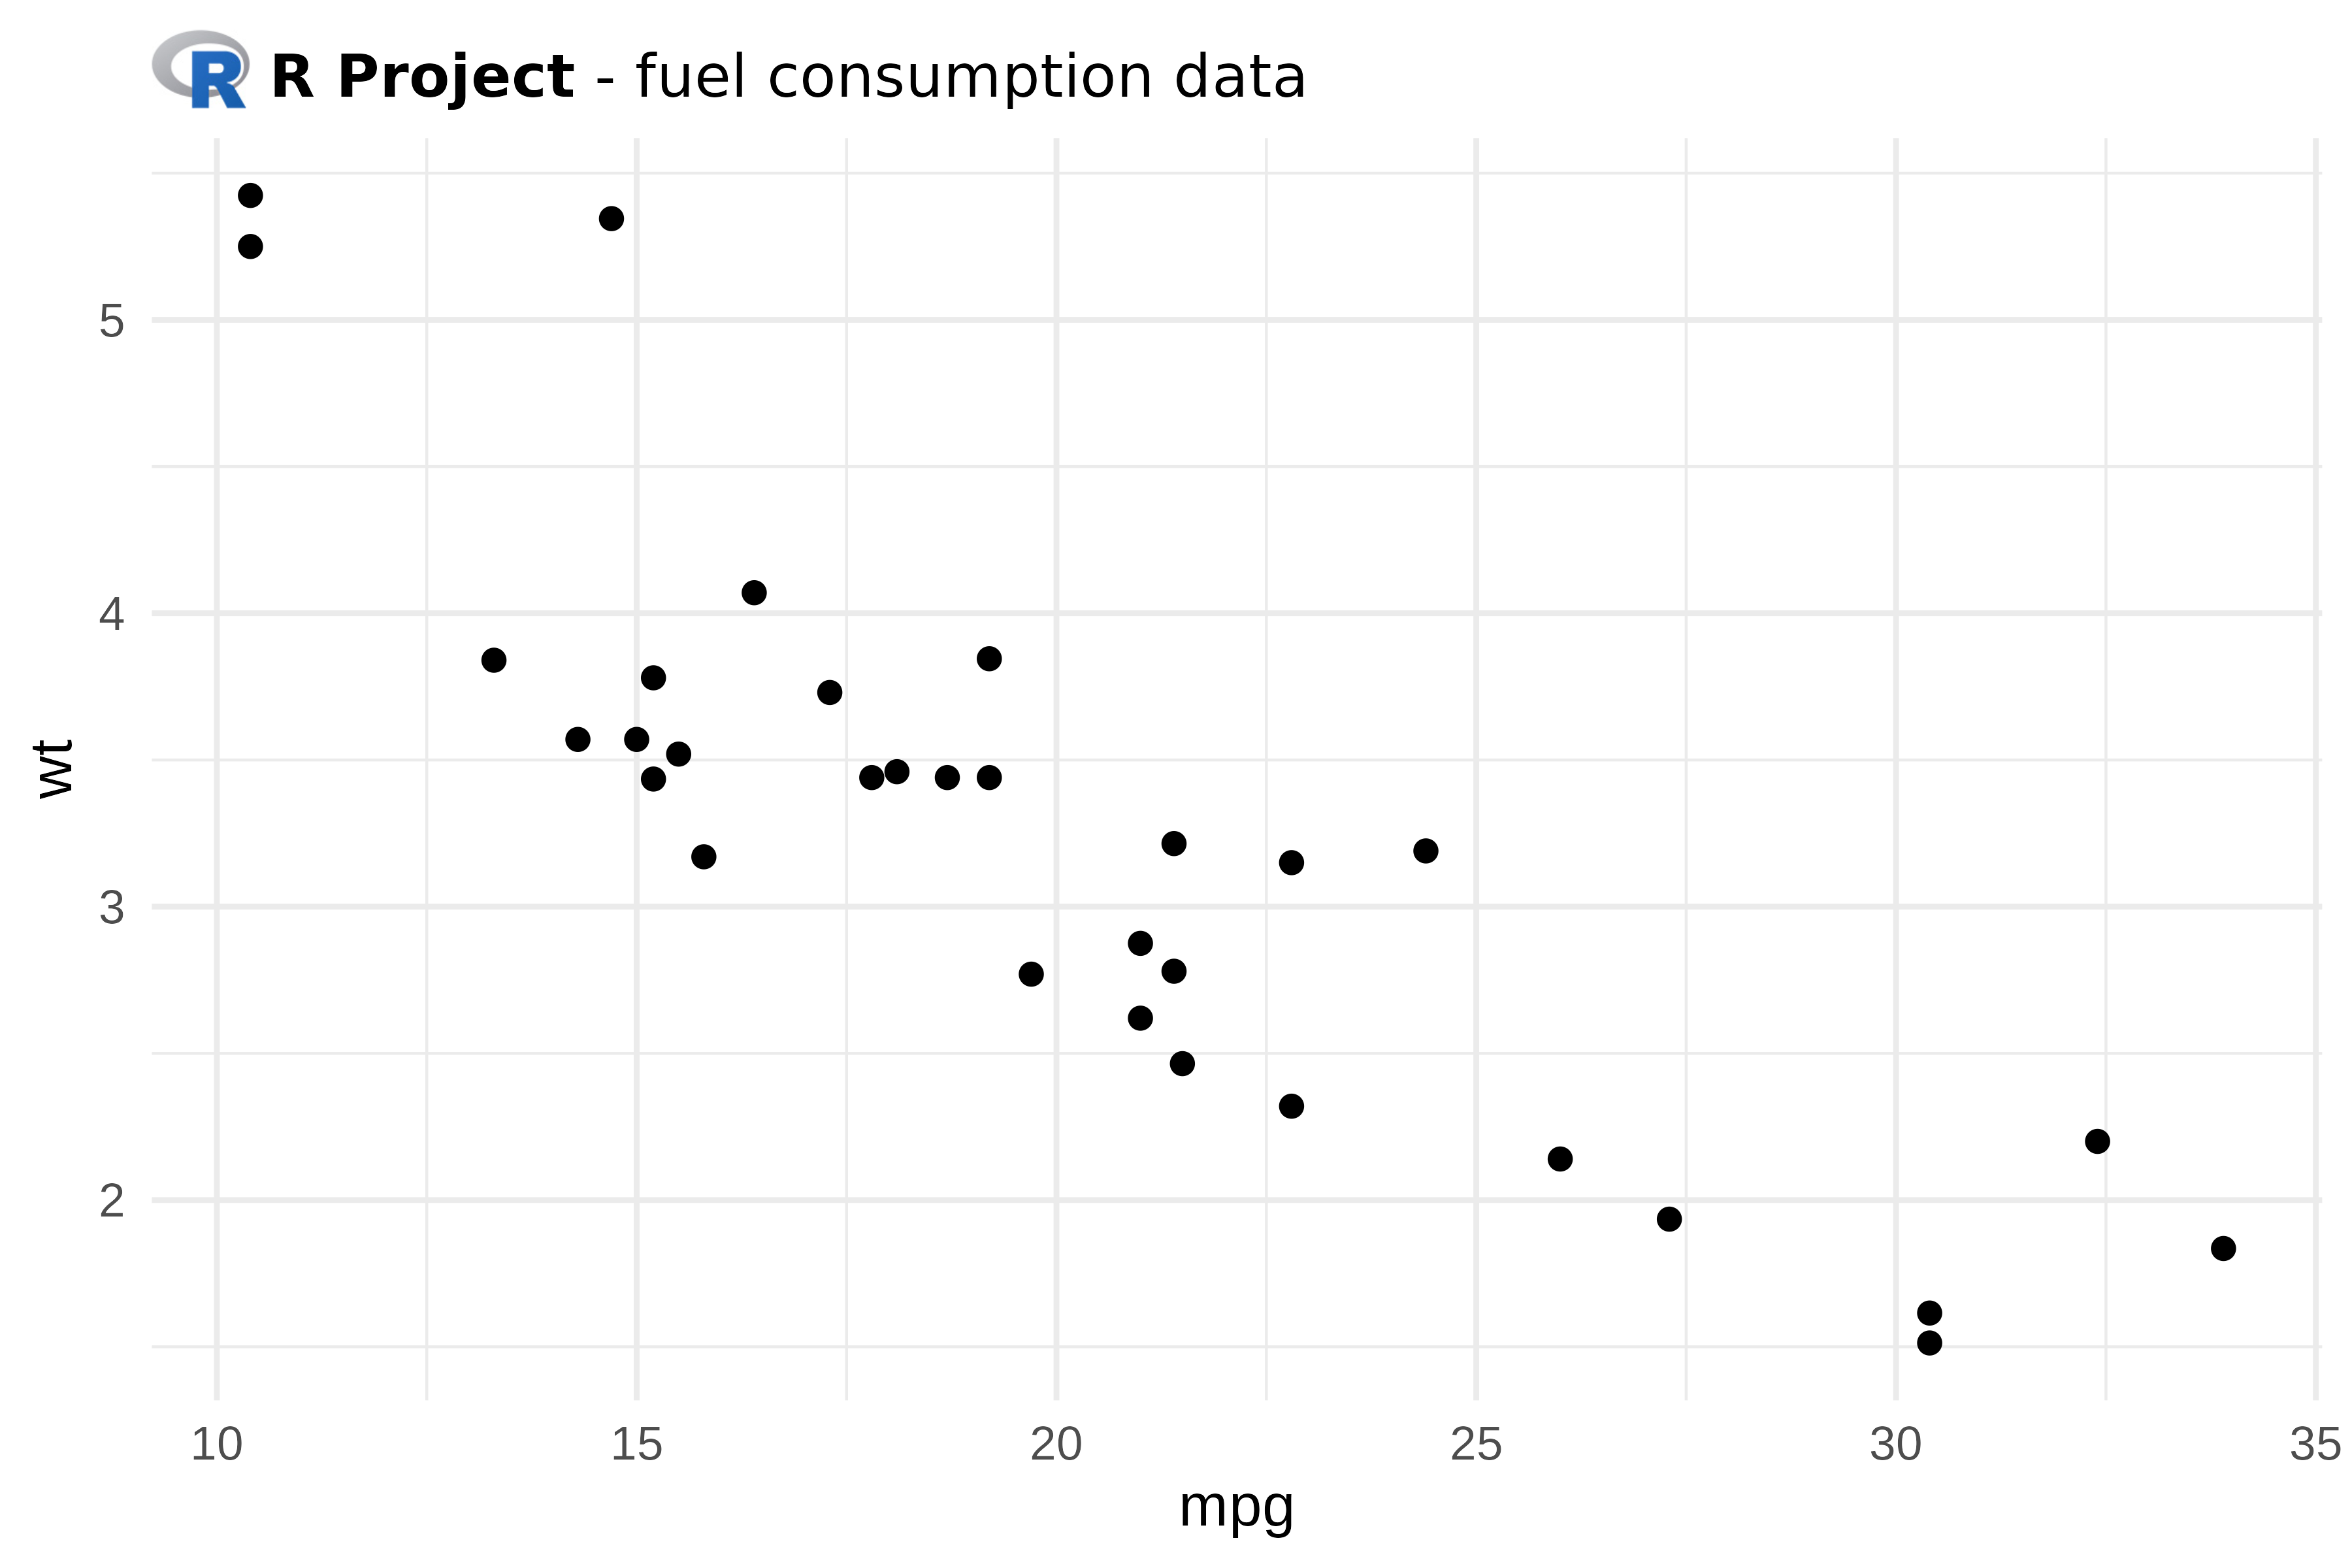
Layout parameters
element_chunks() accepts the same layout parameters as
element_md():
| Parameter | Description |
|---|---|
hjust |
Horizontal justification (0-1) |
vjust |
Vertical justification (0-1) |
angle |
Text rotation angle |
lineheight |
Line height multiplier |
margin |
Margins around text |
width |
Maximum width of the text, in inches |
chunks <- as_paragraph(
  as_chunk("Centered: R"), as_sup("2"),
  as_chunk(" = 0.75")
)

ggplot(mtcars, aes(mpg, wt)) +
  geom_point() +
  theme(plot.title = element_chunks(chunks, hjust = 0.5))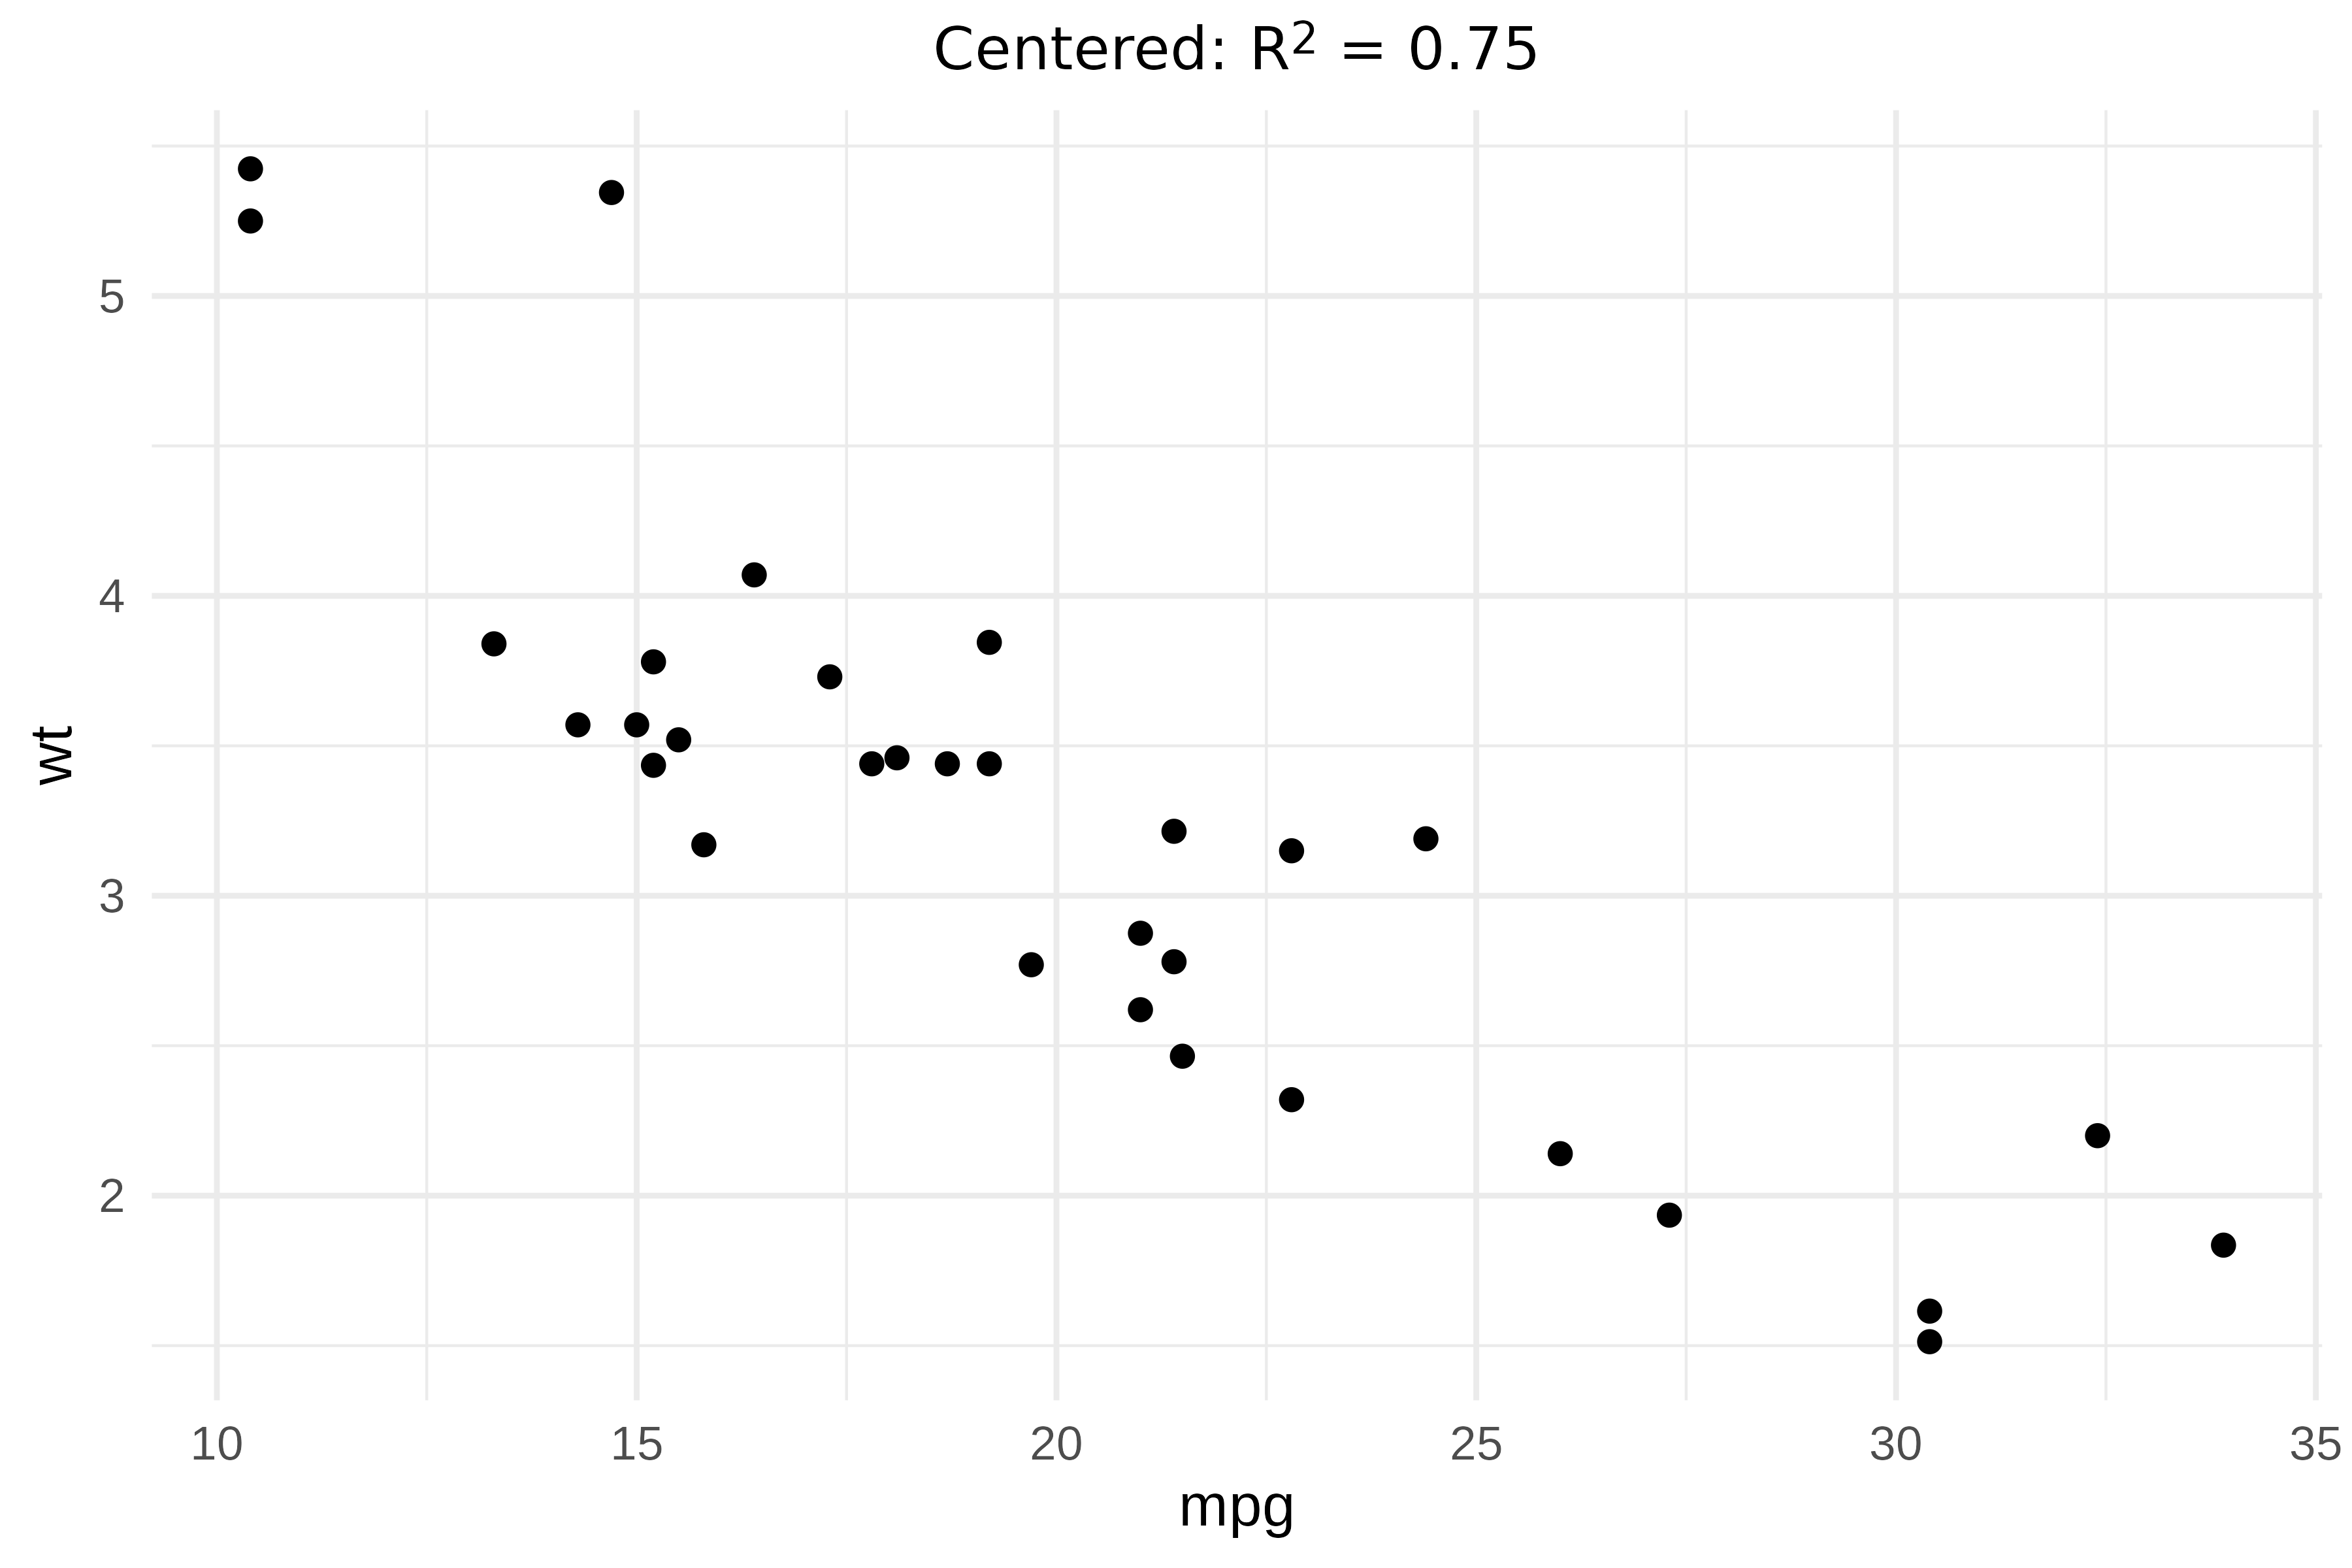
Text annotations with geom_text_md() and geom_label_md()
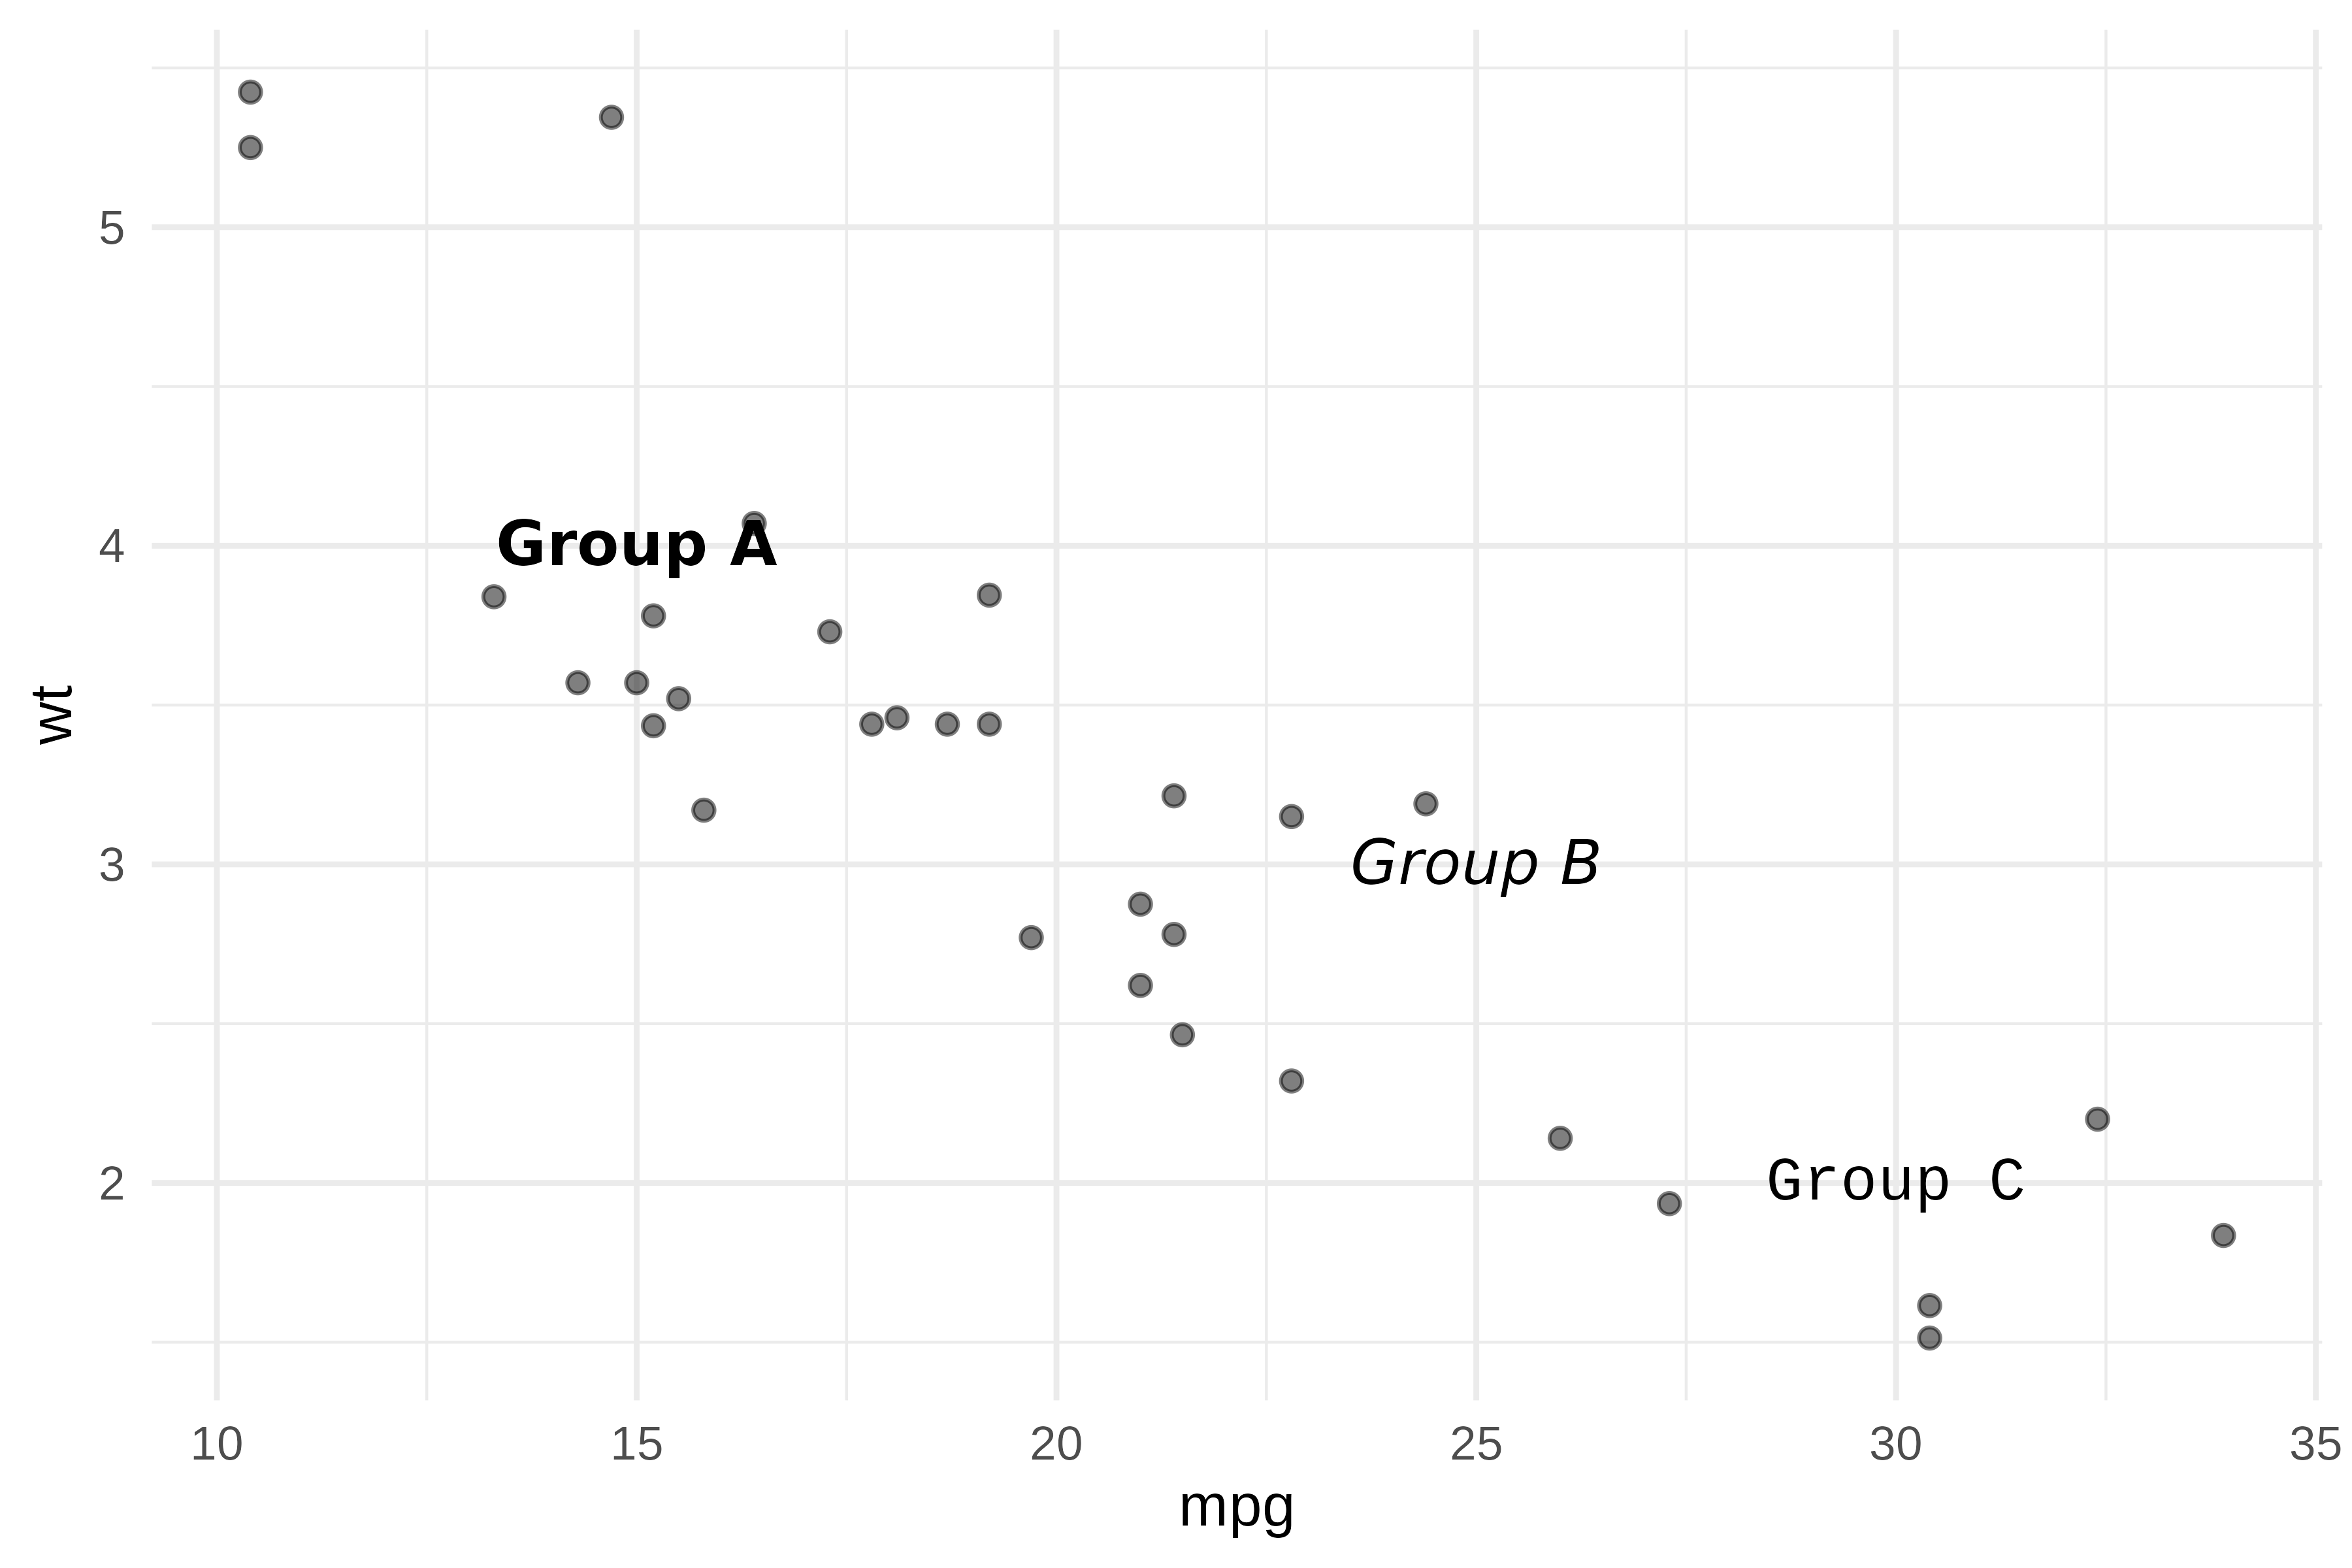
geom_text_md() and geom_label_md() render
markdown-formatted labels directly on the plot, similar to
geom_text() and geom_label().
annotations <- data.frame(
  x = c(15, 25, 30),
  y = c(4, 3, 2),
  label = c("**Group A**", "*Group B*", "`Group C`")
)

ggplot(mtcars, aes(mpg, wt)) +
  geom_point(alpha = 0.5) +
  geom_text_md(
    data = annotations,
    aes(x = x, y = y, label = label),
    size = 4,
    code_font_family = "Liberation Mono"
  )
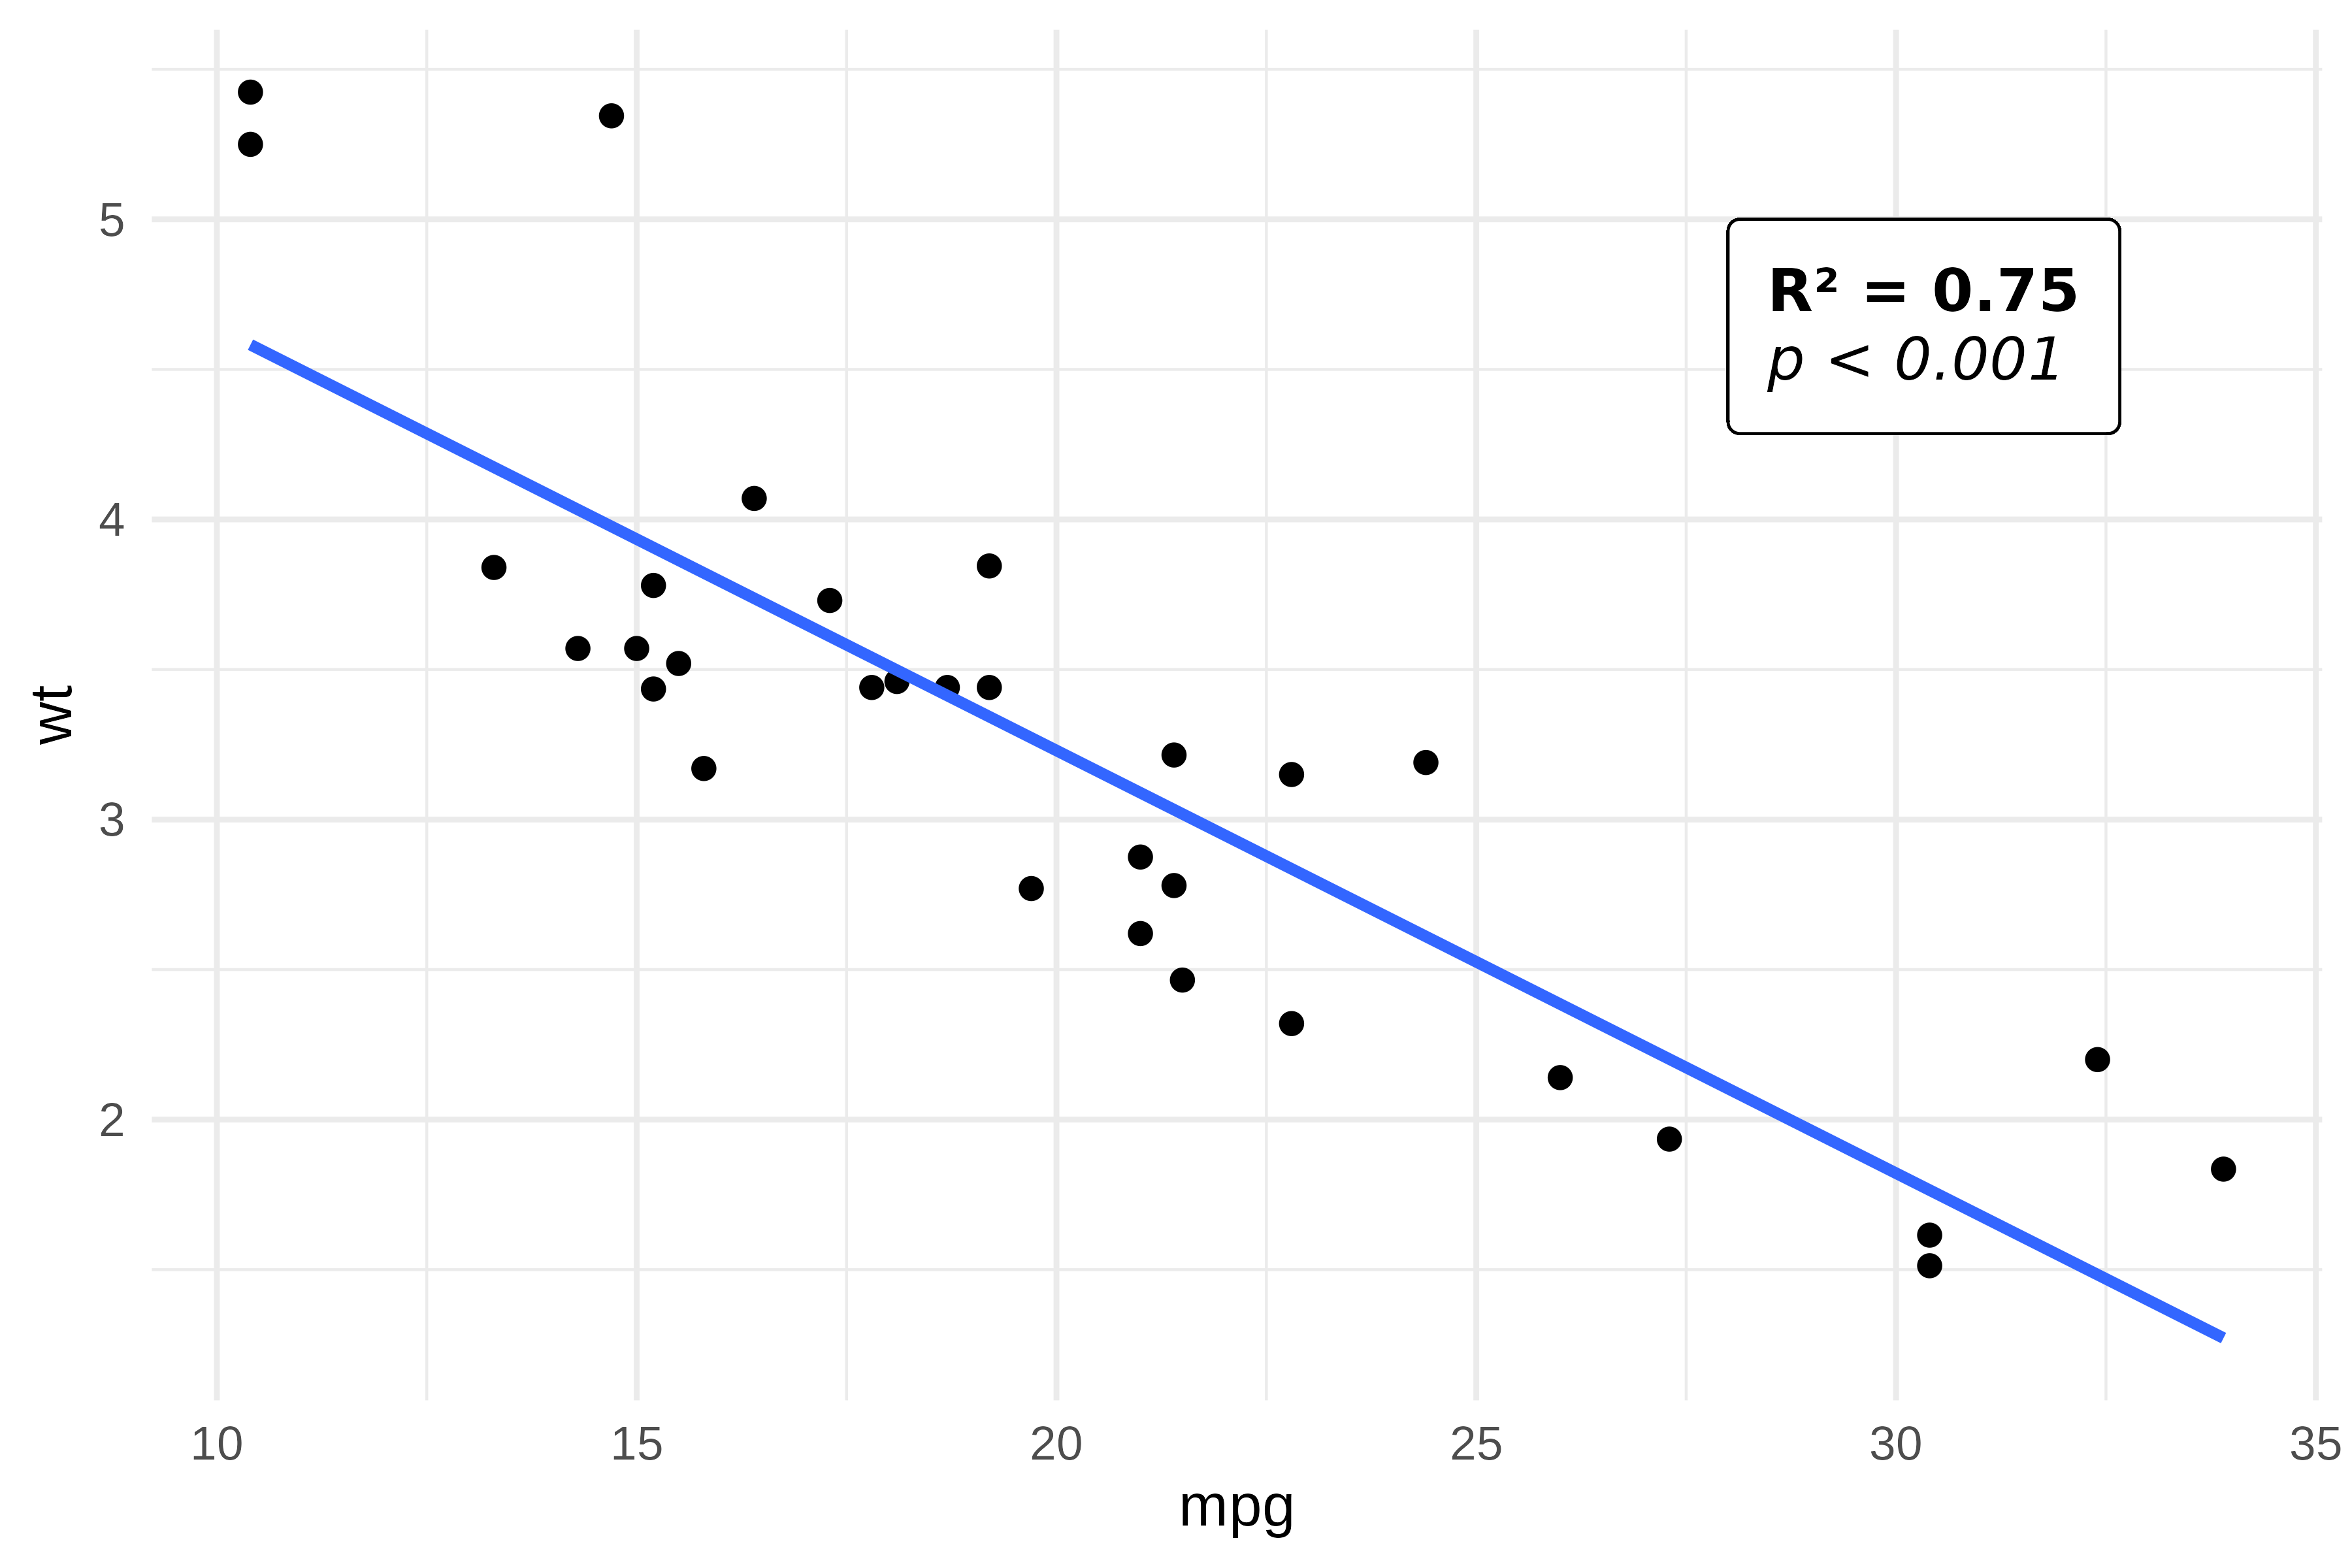
geom_label_md() adds a background rectangle for better
readability:
ggplot(mtcars, aes(mpg, wt)) +
  geom_point() +
  geom_smooth(method = "lm", se = FALSE) +
  geom_label_md(
    label = "**R\u00B2 = 0.75**\n\n*p < 0.001*",
    x = 28, y = 5,
    hjust = 0, vjust = 1,
    fill = "white",
    label.padding = unit(0.5, "lines")
  )
Text wrapping
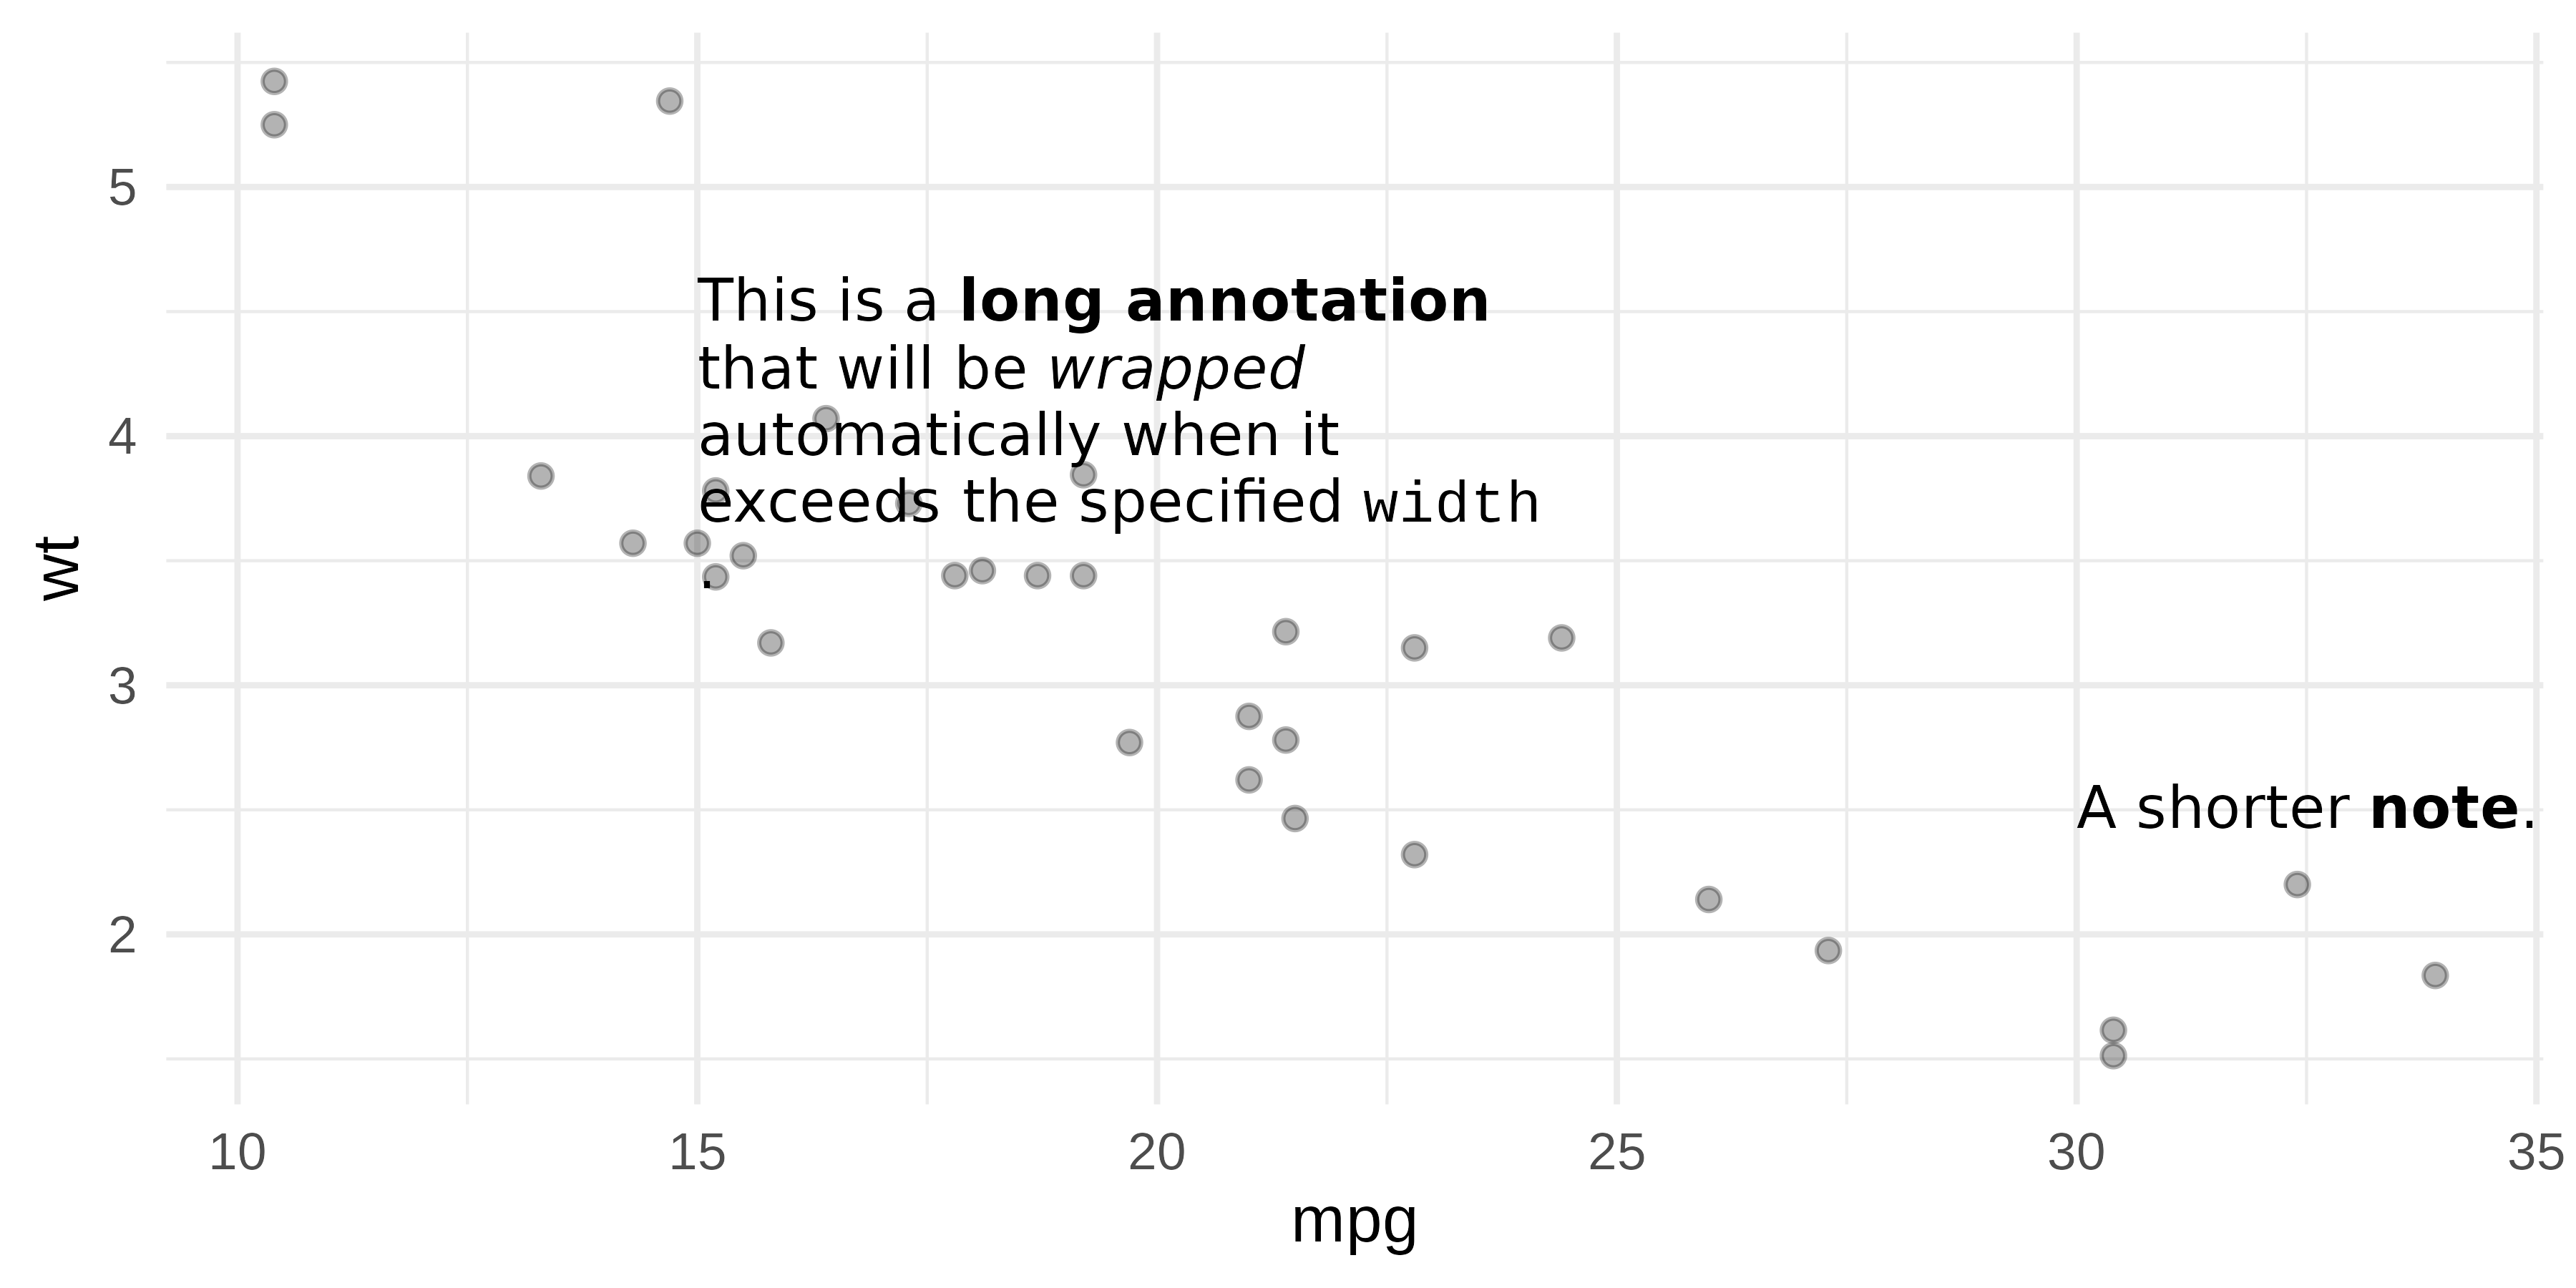
geom_text_md() and geom_label_md() support
the width parameter (in inches) for automatic line
wrapping:
df <- data.frame(
  x = c(15, 30),
  y = c(4, 2.5),
  label = c(
    "This is a **long annotation** that will be *wrapped* automatically when it exceeds the specified `width`.",
    "A shorter **note**."
  )
)

ggplot(mtcars, aes(mpg, wt)) +
  geom_point(alpha = 0.3) +
  geom_text_md(
    data = df,
    aes(x = x, y = y, label = label),
    width = 2, hjust = 0, size = 3.5,
    code_font_family = "Liberation Mono"
  )
Images in labels
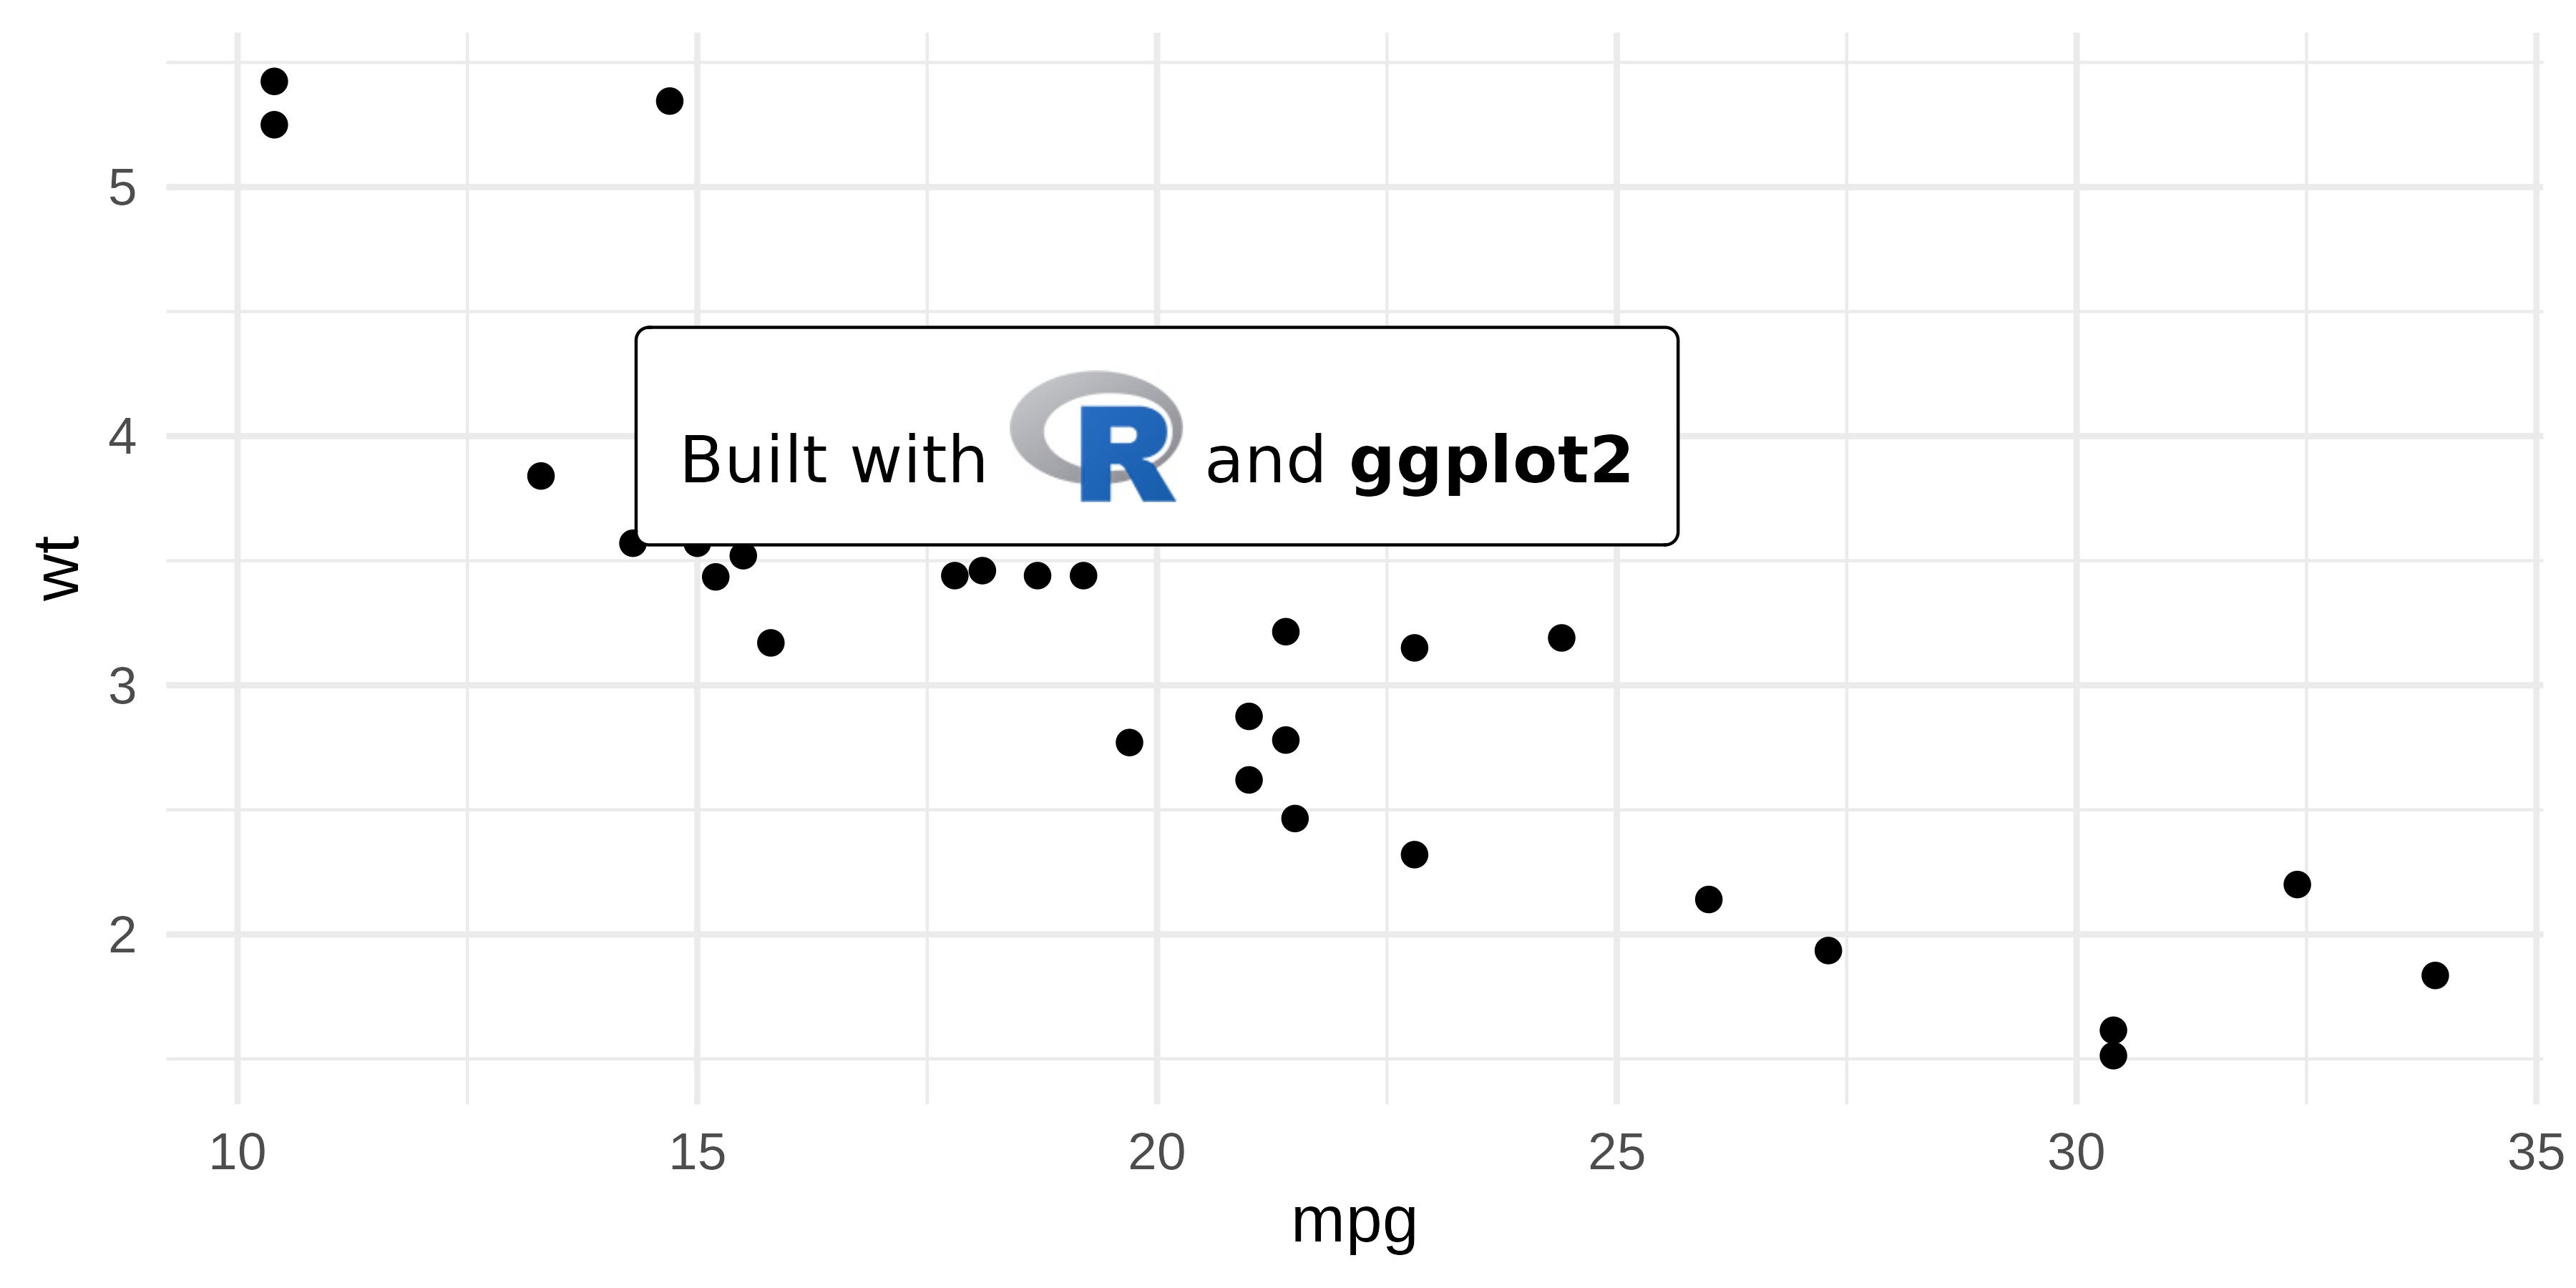
Use markdown image syntax  to embed images in
geom_label_md():
r_logo <- file.path(R.home("doc"), "html", "logo.jpg")
df <- data.frame(
x = 20, y = 4,
label = sprintf("Built with  and **ggplot2**", r_logo)
)
ggplot(mtcars, aes(mpg, wt)) +
geom_point() +
geom_label_md(
data = df,
aes(x = x, y = y, label = label),
fill = "white",
label.padding = unit(0.5, "lines")
)
Alignment accuracy
‘munch’ measures text with ‘gdtools’, which adds up the advance widths of the glyphs read from the font file. Kerning, the adjustment of the space between some pairs of letters, is not applied. Devices such as ‘ragg’, ‘svglite’ or ‘ggiraph’ apply it when they draw the text, so a word can be drawn slightly narrower than measured.
The difference is negligible for most words, but can reach about 7% of the width of words with pairs such as “AV”, “To” or “WA” (for example “AVATAR”). Each word is placed at its measured position, so the differences do not add up along a line. Their visible effects are:
- a slightly wider space after such a word;
- with
hjust = 1(right-aligned), a line ending with such a word stops slightly before the right edge; withhjust = 0.5, the difference is half as large on each side; withhjust = 0, the left edge is exact.
Taking kerning into account in measurements is planned.
Choosing the right approach
| Feature | element_md() |
element_chunks() |
geom_*_md() |
|---|---|---|---|
| Bold / Italic |
**text** / *text*
|
as_b() / as_i()
|
**text** / *text*
|
| Inline code | `text` |
x | `text` |
| Superscript | x | as_sup() |
x |
| Subscript | x | as_sub() |
x |
| Colors | x | colorize() |
x |
| Highlighting | x | as_highlight() |
x |
| Use case | Theme elements | Theme elements | Text annotations |
-
element_md(), simple markdown in theme elements (titles, captions, axes). -
element_chunks(), rich formatting with superscripts, subscripts, colors. Uses the same vocabulary as ‘flextable’, making it easy to reuse patterns across plots and tables. -
geom_text_md()/geom_label_md(), markdown annotations placed at specific coordinates on the plot.