Using the flextable R package
2026-06-10
Chapter 1 Overview
The flextable package provides a framework to easily create tables for reporting and publications. Functions are provided to let users create tables, modify and format their content, and define their content.
Tables can be embedded within:
- R Markdown and Quarto documents with support for HTML, Word, PDF and
PowerPoint documents, plus Typst (
format: typst) with Quarto. - Microsoft Word or PowerPoint documents with package officer.
Tables can also be rendered as R plots or graphic files (png, pdf and jpeg).

1.1 Introduction
flextable can easily create reporting tables from data.frame. It also allows you to
merge cells, add header rows, add footer rows, change all formatting
and specify how data should be displayed in cells. Table contents can also
contain a mix of content types such as text and images.
The following table is an example of a flextable rendered in HTML.
ft <- flextable(airquality[ sample.int(10),])
ft <- add_header_row(ft,
  colwidths = c(4, 2),
  values = c("Air quality", "Time")
)
ft <- theme_vanilla(ft)
ft <- add_footer_lines(ft, "Daily air quality measurements in New York, May to September 1973.")
ft <- color(ft, part = "footer", color = "#666666")
ft <- set_caption(ft, caption = "New York Air Quality Measurements")
ftAir quality |
Time |
||||
|---|---|---|---|---|---|
Ozone |
Solar.R |
Wind |
Temp |
Month |
Day |
36 |
118 |
8.0 |
72 |
5 |
2 |
28 |
14.9 |
66 |
5 |
6 |
|
23 |
299 |
8.6 |
65 |
5 |
7 |
8 |
19 |
20.1 |
61 |
5 |
9 |
41 |
190 |
7.4 |
67 |
5 |
1 |
18 |
313 |
11.5 |
62 |
5 |
4 |
12 |
149 |
12.6 |
74 |
5 |
3 |
194 |
8.6 |
69 |
5 |
10 |
|
14.3 |
56 |
5 |
5 |
||
19 |
99 |
13.8 |
59 |
5 |
8 |
Daily air quality measurements in New York, May to September 1973. | |||||
1.2 Create a flextable
1.2.1 Build with a data.frame
The main function is flextable which takes a data.frame
as argument and returns a flextable. If you are using RStudio or another R GUI, the table will
be displayed in the Viewer panel or in your default browser.
flextable(world_phones)year |
N.Amer |
Europe |
Asia |
S.Amer |
Oceania |
Africa |
Mid.Amer |
|---|---|---|---|---|---|---|---|
1951 |
45 939 |
21 574 |
2 876 |
1 815 |
1 646 |
89 |
555 |
1956 |
60 423 |
29 990 |
4 708 |
2 568 |
2 366 |
1 411 |
733 |
1957 |
64 721 |
32 510 |
5 230 |
2 695 |
2 526 |
1 546 |
773 |
1958 |
68 484 |
35 218 |
6 662 |
2 845 |
2 691 |
1 663 |
836 |
1959 |
71 799 |
37 598 |
6 856 |
3 000 |
2 868 |
1 769 |
911 |
1960 |
76 036 |
40 341 |
8 220 |
3 145 |
3 054 |
1 905 |
1 008 |
1961 |
79 831 |
43 173 |
9 053 |
3 338 |
3 224 |
2 005 |
1 076 |
This table uses black ‘Helvetica’ font in size 11, these are the default
formatting properties but can be customised. They can also be changed with dedicated
functions such as bold() and color().
It also uses a simple formatting function to create the paragraphs of text that will be rendered in each cell. This can be changed also with dedicated functions.
In order to easily have all flextables use the same formatting, it is recommended to define formatting properties such as font, border color, number of decimals displayed using the set_flextable_defaults function.
set_flextable_defaults(
  font.size = 10, theme_fun = theme_vanilla,
  padding = 6,
  background.color = "#EFEFEF")
flextable(world_phones)
year |
N.Amer |
Europe |
Asia |
S.Amer |
Oceania |
Africa |
Mid.Amer |
|---|---|---|---|---|---|---|---|
1951 |
45 939 |
21 574 |
2 876 |
1 815 |
1 646 |
89 |
555 |
1956 |
60 423 |
29 990 |
4 708 |
2 568 |
2 366 |
1 411 |
733 |
1957 |
64 721 |
32 510 |
5 230 |
2 695 |
2 526 |
1 546 |
773 |
1958 |
68 484 |
35 218 |
6 662 |
2 845 |
2 691 |
1 663 |
836 |
1959 |
71 799 |
37 598 |
6 856 |
3 000 |
2 868 |
1 769 |
911 |
1960 |
76 036 |
40 341 |
8 220 |
3 145 |
3 054 |
1 905 |
1 008 |
1961 |
79 831 |
43 173 |
9 053 |
3 338 |
3 224 |
2 005 |
1 076 |
speed |
dist |
|---|---|
4 |
2 |
4 |
10 |
7 |
4 |
7 |
22 |
8 |
16 |
9 |
10 |
1.2.2 Transform to flextable
The package provides a set of functions to easily create some tables from other objects.
The as_flextable() function is used to transform specific objects into flextable objects. For example, you can transform a crosstab produced with the ‘tables’ package into a flextable which can then be formatted, annotated or augmented with footnotes.
The chapter 10 lists the supported objects and explains how to use them.
1.3 Help and resources
Function reference (manuals) is available here: https://davidgohel.github.io/flextable/reference/index.html. These manuals are also available when using R as usual help pages.
A cheat sheet has been written by Clémentine Jager and is available here: Flextable cheat sheet
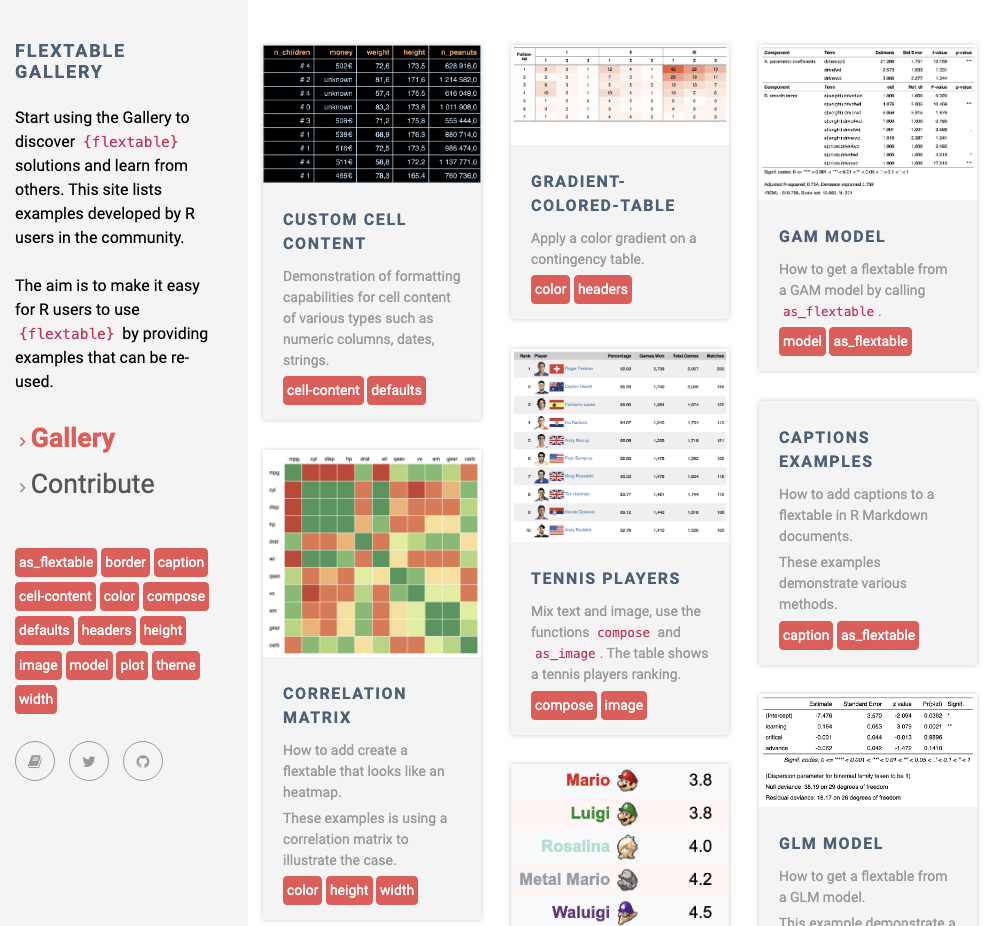
You can also consult the gallery of examples which is available here. It is composed of examples with code to allow their reproduction.
The gallery is available here: https://ardata.fr/en/flextable-gallery/
1.4 Walkthrough: simple example
flextable has been designed to allow the construction of simple and complex tables. A set of functions will allow you to change colors, fonts, add headers and many other things to give you the possibility to build the tables that fit your needs.
Let’s go through a simple step-by-step demo.
First, the flextable has to be created.
am |
carb |
gear |
mpg |
drat |
|---|---|---|---|---|
1 |
4 |
4 |
21.0 |
3.90 |
1 |
4 |
4 |
21.0 |
3.90 |
1 |
1 |
4 |
22.8 |
3.85 |
0 |
1 |
3 |
21.4 |
3.08 |
0 |
2 |
3 |
18.7 |
3.15 |
0 |
1 |
3 |
18.1 |
2.76 |
Optional argument col_keys is used to only display a subset of columns.
Many sugar functions can be used to format flextables: bg(), fontsize(), italic(), bold(), color(), padding()…
flextable separates the data and the display of the data. This makes it possible to implement conditional formatting. Conditional formatting can be made by using the selector arguments. All formatting functions accept selector arguments.
myft <- italic(myft, j = 3)
myft <- color(myft, ~ drat > 3.5, ~ drat, color = "red")
myft <- bold(myft, ~ drat > 3.5, ~ drat, bold = TRUE)
myft
am |
carb |
gear |
mpg |
drat |
|---|---|---|---|---|
1 |
4 |
4 |
21.0 |
3.90 |
1 |
4 |
4 |
21.0 |
3.90 |
1 |
1 |
4 |
22.8 |
3.85 |
0 |
1 |
3 |
21.4 |
3.08 |
0 |
2 |
3 |
18.7 |
3.15 |
0 |
1 |
3 |
18.1 |
2.76 |
Table layout can be modified. One can add or change header/footer rows, change cells height and width, and merge cells.
myft <- add_header_row(
  x = myft, values = c("some measures", "other measures"),
  colwidths = c(3, 2))
myft <- align(myft, i = 1, part = "header", align = "center")
myft
some measures |
other measures |
|||
|---|---|---|---|---|
am |
carb |
gear |
mpg |
drat |
1 |
4 |
4 |
21.0 |
3.90 |
1 |
4 |
4 |
21.0 |
3.90 |
1 |
1 |
4 |
22.8 |
3.85 |
0 |
1 |
3 |
21.4 |
3.08 |
0 |
2 |
3 |
18.7 |
3.15 |
0 |
1 |
3 |
18.1 |
2.76 |
Functions theme_ are sugar functions whose role is to apply a set
of formatting instructions to a flextable.
myft <- theme_vanilla(myft)
myft
some measures |
other measures |
|||
|---|---|---|---|---|
am |
carb |
gear |
mpg |
drat |
1 |
4 |
4 |
21.0 |
3.90 |
1 |
4 |
4 |
21.0 |
3.90 |
1 |
1 |
4 |
22.8 |
3.85 |
0 |
1 |
3 |
21.4 |
3.08 |
0 |
2 |
3 |
18.7 |
3.15 |
0 |
1 |
3 |
18.1 |
2.76 |
The set_table_properties() function lets you specify formatting options for the flextable in relation to the document that will contain it. It is with this function that you can specify how to right align the table in the document for example. You can also specify specific options for the HTML format (such as adding a vertical or horizontal scrollbar), the PDF format and the Word format.
myft <- set_table_properties(myft, align = "right", layout = "autofit")
myft
some measures |
other measures |
|||
|---|---|---|---|---|
am |
carb |
gear |
mpg |
drat |
1 |
4 |
4 |
21.0 |
3.90 |
1 |
4 |
4 |
21.0 |
3.90 |
1 |
1 |
4 |
22.8 |
3.85 |
0 |
1 |
3 |
21.4 |
3.08 |
0 |
2 |
3 |
18.7 |
3.15 |
0 |
1 |
3 |
18.1 |
2.76 |