Chapter 7 Rendering
Tables created as ‘flextable’ objects can be rendered in several formats: HTML, Word, RTF, PowerPoint, PDF, PNG and Typst. The package offers simple export functions, works inside ‘R Markdown’ and ‘Quarto’ documents and works with the ‘officer’ package.
When working in RStudio, flextable will be printed in the rstudio viewer pane as an HTML table, the default format is HTML output.
7.1 Simple export
It is possible to easily export one or more tables into Word, RTF, PowerPoint, PNG, HTML and Typst documents. Each format has its own dedicated function.
Functions save_as_html(), save_as_pptx(), save_as_rtf(),
save_as_docx() and save_as_typst() can be used to export one or more
‘flextables’ into a document. Function save_as_image() can only be used to
export a single ‘flextable’.
save_as_docx(
  "my table 1" = ft1, "my table 2" = ft2,
  path = "/path/to/file.docx")

save_as_rtf(
  "my table 1" = ft1, "my table 2" = ft2,
  path = "/path/to/file.rtf")

save_as_pptx(
  "my table 1" = ft1, "my table 2" = ft2,
  path = "/path/to/file.pptx")

save_as_html(
  "my table 1" = ft1, "my table 2" = ft2,
  path = "/path/to/file.html")

save_as_image(ft, path = "/path/to/file.png")

save_as_typst(ft1, ft2, path = "/path/to/file.typ")
save_as_typst() writes a standalone Typst (.typ) document. Images are
embedded so the file is self-contained and compiles offline with
typst compile.
7.2 In RStudio
In RStudio, the HTML version is displayed in the Viewer pane.
If you have a Word or PowerPoint client on your machine, you can use the print method
with argument preview set to “pptx”, “docx”, “rtf”, “pdf” or “html” the default.
It will produce and open a document where the table will be printed.
7.3 R Markdown documents
flextable can be used in R Markdown documents. Printing a flextable in R Markdown documents is done
automatically. 1
The following R Markdown document shows how to use flextable:
---
title: blah blah
output: html_document
---

> this is how to print a flextable in a R Markdown document

```{r}
library(flextable)
ft <- flextable(head(mtcars))
ft <- autofit(ft)
ft
```
Supported formats require some minimum pandoc versions:
Output format |
pandoc version |
|---|---|
HTML |
>= 1.12 |
Word (docx) |
>= 2.0 |
PowerPoint (pptx) |
>= 2.4 |
>= 1.12 |
7.3.1 Knitr Chunk options
There are knitr chunk options that can be used to help with captions and table properties.
These options should be set with knitr::opts_chunk$set():
- knitr chunk options for table captions:
-
tab.id: caption id/bookmark (default to NULL) -
tab.cap: caption (default to NULL) -
tab.topcaption: display table caption on top of the table or not (default to TRUE) -
tab.lp: caption table sequence identifier: (default to “tab:”)
-
- knitr chunk options for Word table captions:
-
tab.cap.style: Word stylename to use for table captions (default to NULL) -
tab.cap.pre: prefix for numbering chunk (default to “Table”) -
tab.cap.sep: suffix for numbering chunk (default to “:”) -
tab.cap.tnd: title number depth (default to 0) -
tab.cap.tns: separator to use between title number and table number (default to “-”) -
tab.cap.fp_text: caption prefix formatting properties (default tofp_text_lite(bold = TRUE))
-
- knitr chunk options for Word tables:
-
tab.layout: “autofit” or “fixed” algorithm (default to “autofit”) -
tab.width: value of the preferred width of the table in percent (default to 1)
-
7.3.2 Looping in R Markdown documents
Some code will not trigger the knitr::knit_print() method. For
example this is the case inside of a for loop within an R code chunk.
In this case, you can use knitr::knit_child() that will print the raw code
adapted to the output format. Chunk option results must be set to asis.
When using knitr::knit_child(), the LaTeX and HTML dependencies required to
render the content from the included file are automatically detected and
integrated into the parent document. This means that if your included file
contains elements that require specific LaTeX or HTML packages (this is the case
for ‘flextable’), knitr::knit_child() will ensure that all these dependencies
are properly handled and included in the final document.
Note the old function flextable_to_rmd() does not directly handle LaTeX and
HTML dependencies and should not be used anymore.
Here is an illustration. We will need two files:
- the child document
child-loop.Rmd
```{r echo=FALSE}
library(flextable)
flextable::flextable(head(dat)) |>
  set_table_properties(layout = "autofit") |>
  set_caption(caption = caption)
```- and the main document
rmd-print-loop.Rmd.
---
title: blah blah
output: word_document
---
```{r setup, include=FALSE}
knitr::opts_chunk$set(echo = FALSE)
library(flextable)
```
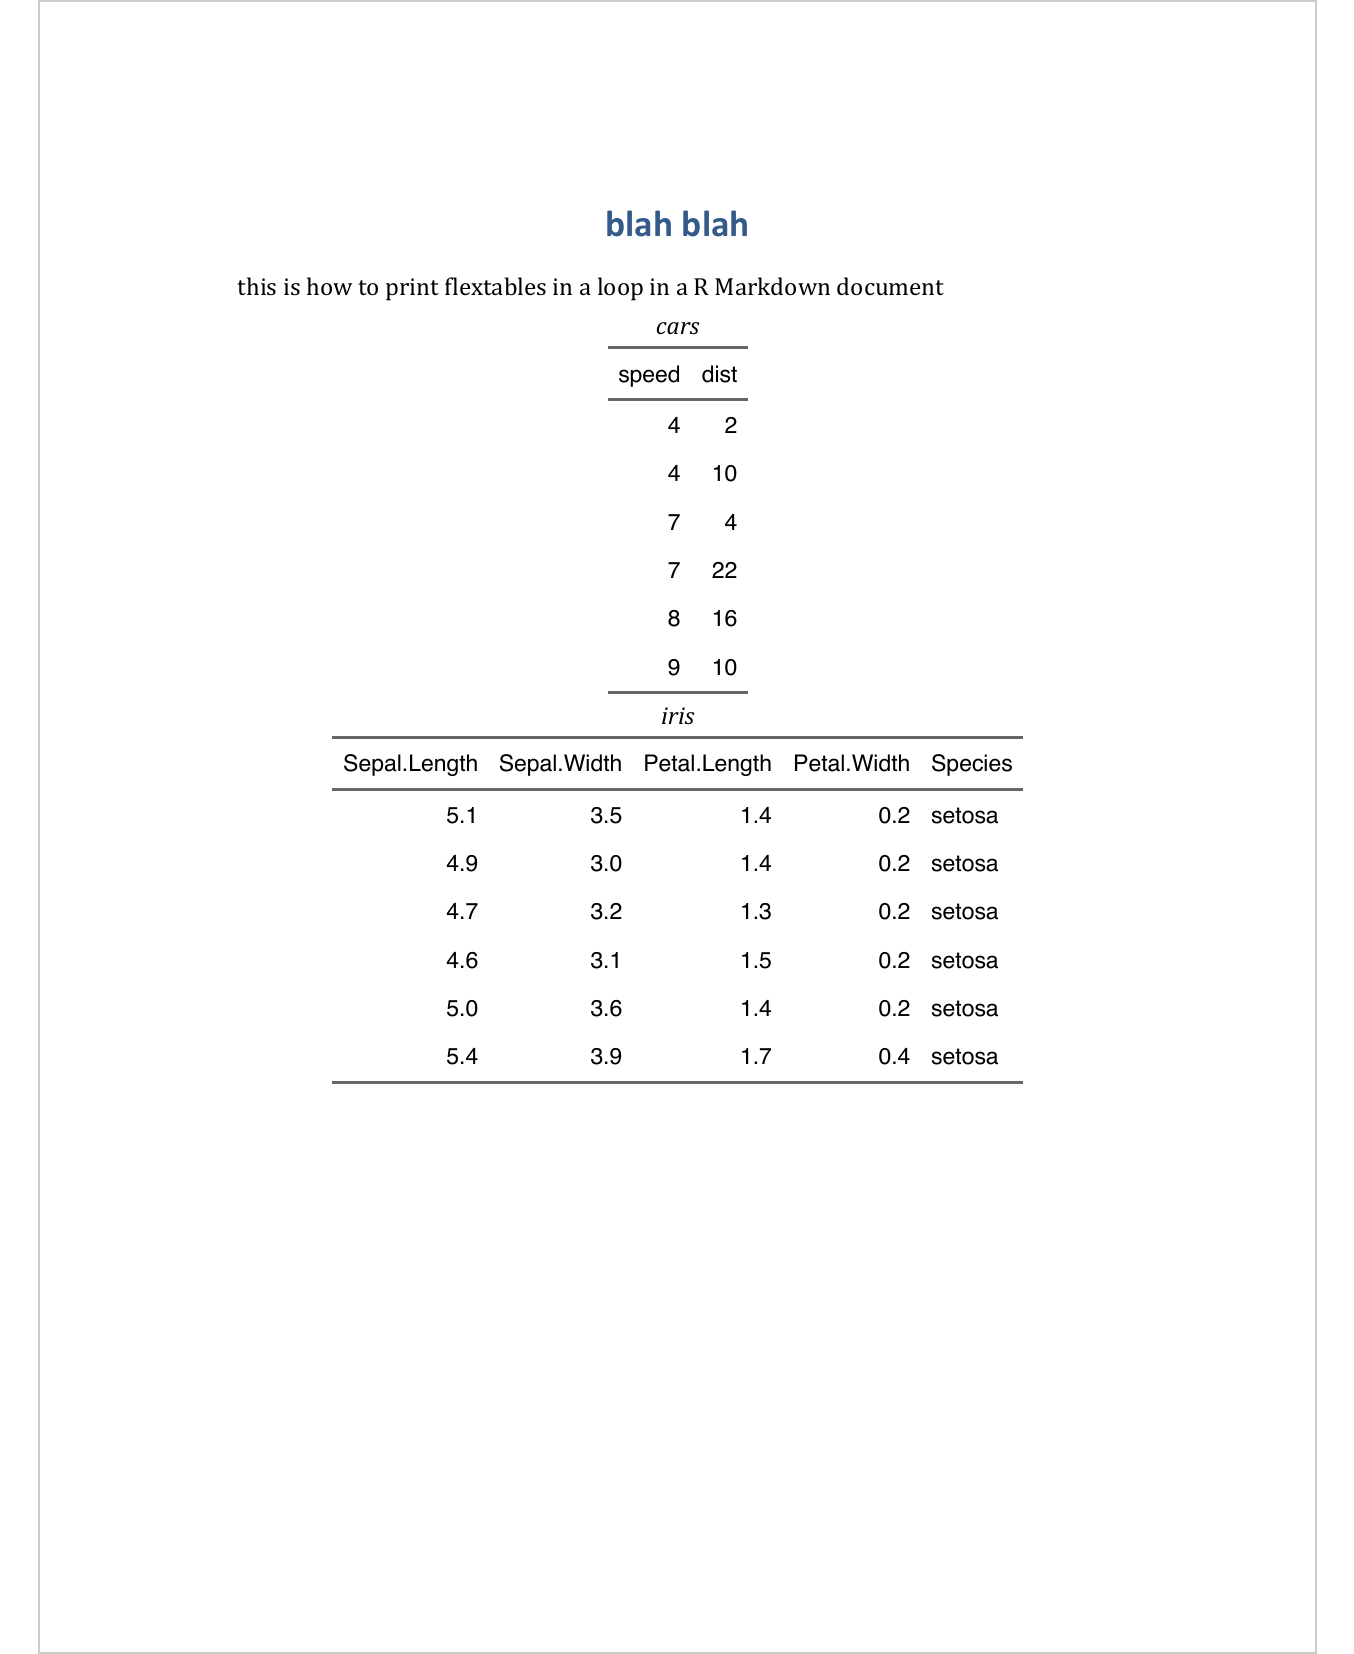
> this is how to print flextables in a loop in a R Markdown document
```{r results='asis', echo=FALSE}
purrr::map2_chr(
.x = c("cars", "iris"),
.y = list(cars, iris),
function(caption, dat) {
knitr::knit_child(input = "child-loop.Rmd", envir = environment(), quiet = TRUE)
}) |>
cat(sep = '\n')
```
7.3.3 Limitations
This limitation concerns the usage of ‘flextable’ in an ‘R Markdown’ document with ‘Word’ as output format. If you use hyperlinks or images in the table, you should use
officedown::rdocx_document()instead ofrmarkdown::word_document(). ‘pandoc’ does not provide a mechanism for handling images nor hyperlinks from raw blocks and therefore it is not possible with ‘R Markdown’.-
The PDF version of the flextable ignores some features of flextable, here is the list of unsupported/ignored options (they may be implemented later):
- only
padding.leftandpadding.rightare supported;padding.topandpadding.bottomare ignored. Global horizontal spacing can also be set withft.tabcolsep, - the borders can only be full (no dash for example),
- the height of the lines cannot be defined.
- In order to be able to change LaTeX font in a flextable,
PDF engine should be specified by adding
latex_engine: xelatexin the YAML header of the R Markdown document. The default onepdflatexdoes not enable the use of system fonts.
- only
7.4 Quarto documents
flextable works in Quarto documents for HTML, PDF, Word and Typst
(format: typst) outputs. Tables are printed automatically, just as with
R Markdown. For Typst, tables are rendered as native Typst #table() code
(vector output, not an image), and captions and cross-references are handled
by Quarto without any extra setup.
The flextable-qmd Lua filter extension adds support for Quarto
markdown inside flextable cells: cross-references (@tbl-xxx,
@fig-xxx), bold/italic, links, inline code, math and shortcodes.
To use it:
- Install the extension once per project:
flextable::use_flextable_qmd()- Add the filter to your document YAML. For HTML, PDF and Typst:
For Word (docx), add the post-render filter that removes wrapper tables Quarto creates around labelled flextables:
- Use
as_qmd()in your flextable cells:
ft <- mk_par(ft, j = "ref",
  value = as_paragraph(as_qmd("See @tbl-results")))
See ?as_qmd and ?use_flextable_qmd for full documentation.
7.5 PowerPoint or Word documents with officer
To add these objects in PowerPoint or Word documents, use functions:
-
ph_with()for PowerPoint -
body_add_flextable()for Word -
rtf_add()for RTF
The following is producing a PowerPoint document:
library(officer)
ft1 <- qflextable(head(airquality))
ft2 <- as_flextable(cars)

ppt <- read_pptx()
ppt <- add_slide(ppt, layout = "Title and Content", master = "Office Theme")
ppt <- ph_with(ppt, value = ft1, location = ph_location_left())
ppt <- ph_with(ppt, value = ft2, location = ph_location_right())

print(ppt, target = "reports/example_table_powerpoint.pptx")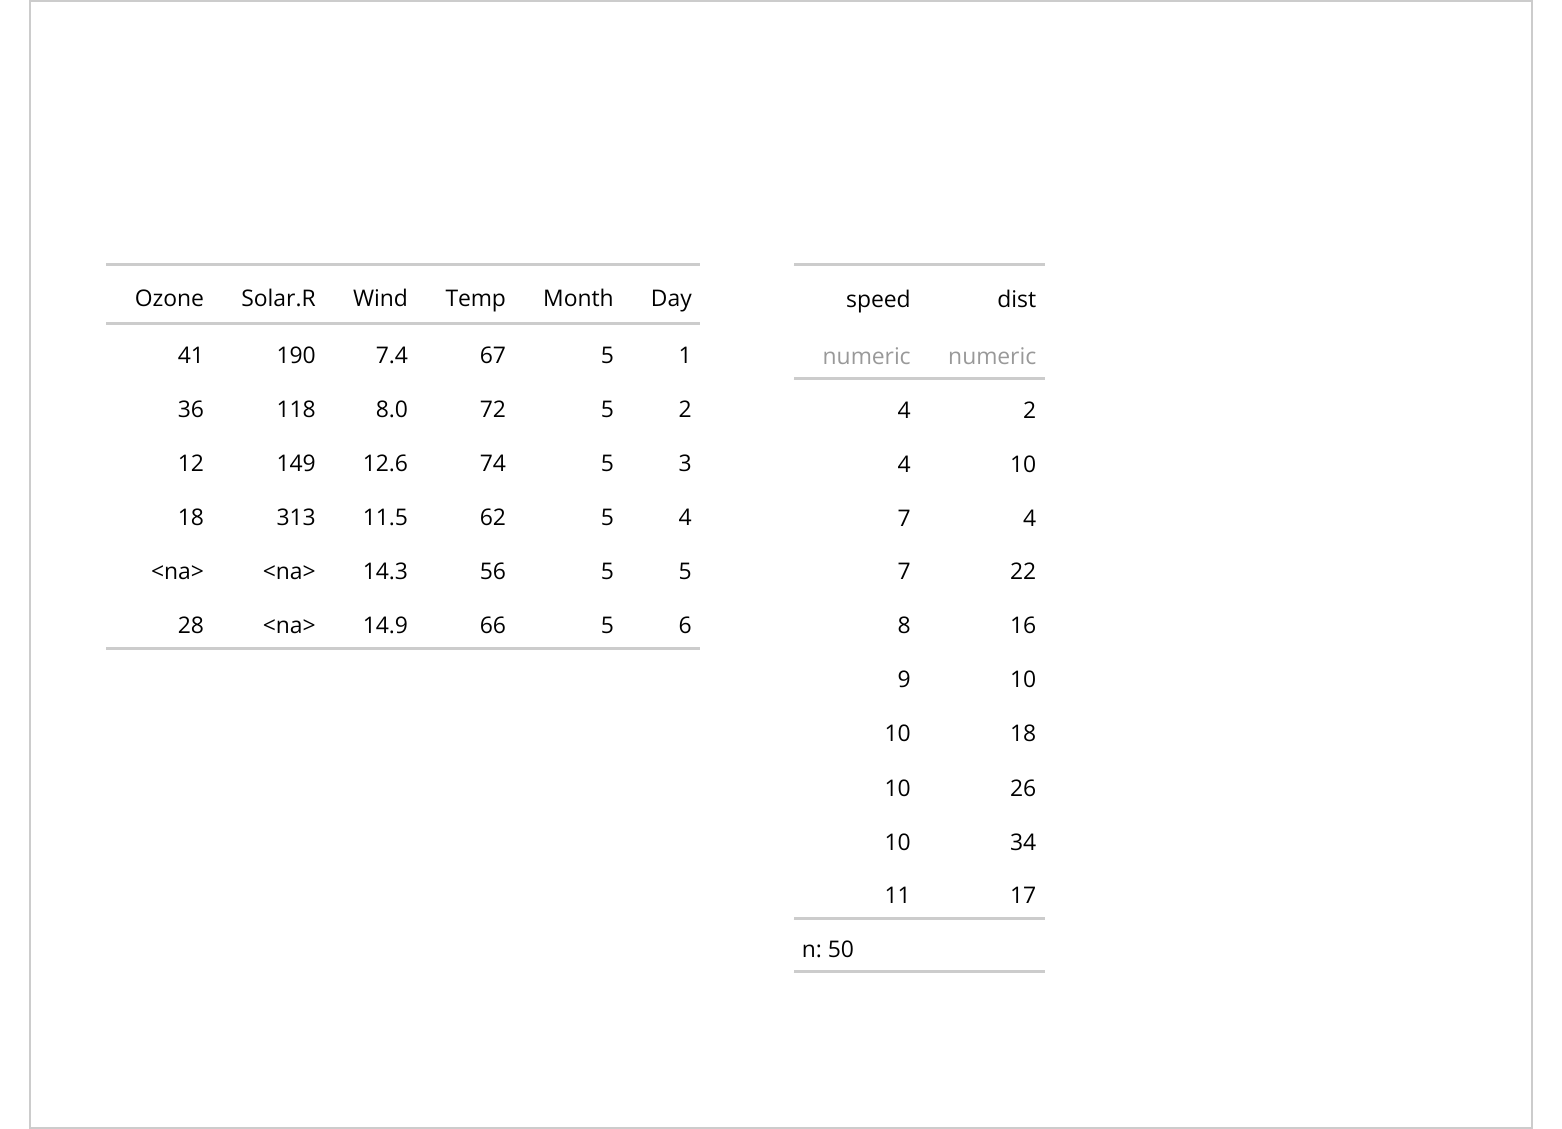
If you want to center the flextable on a PowerPoint slide, it’s up to you to do the calculation.
For that, you can use functions flextable::flextable_dim and officer::slide_size:
ppt <- read_pptx()
ppt <- add_slide(ppt, layout = "Title and Content", master = "Office Theme")

t_s <- flextable_dim(ft1)$widths
s_s <- slide_size(ppt)$width
left <- (s_s/2) - (t_s/2)

ppt <- ph_with(ppt, value = ft1, location = ph_location(left = left, top = 1.5))

print(ppt, target = "reports/example_table_powerpoint_center.pptx")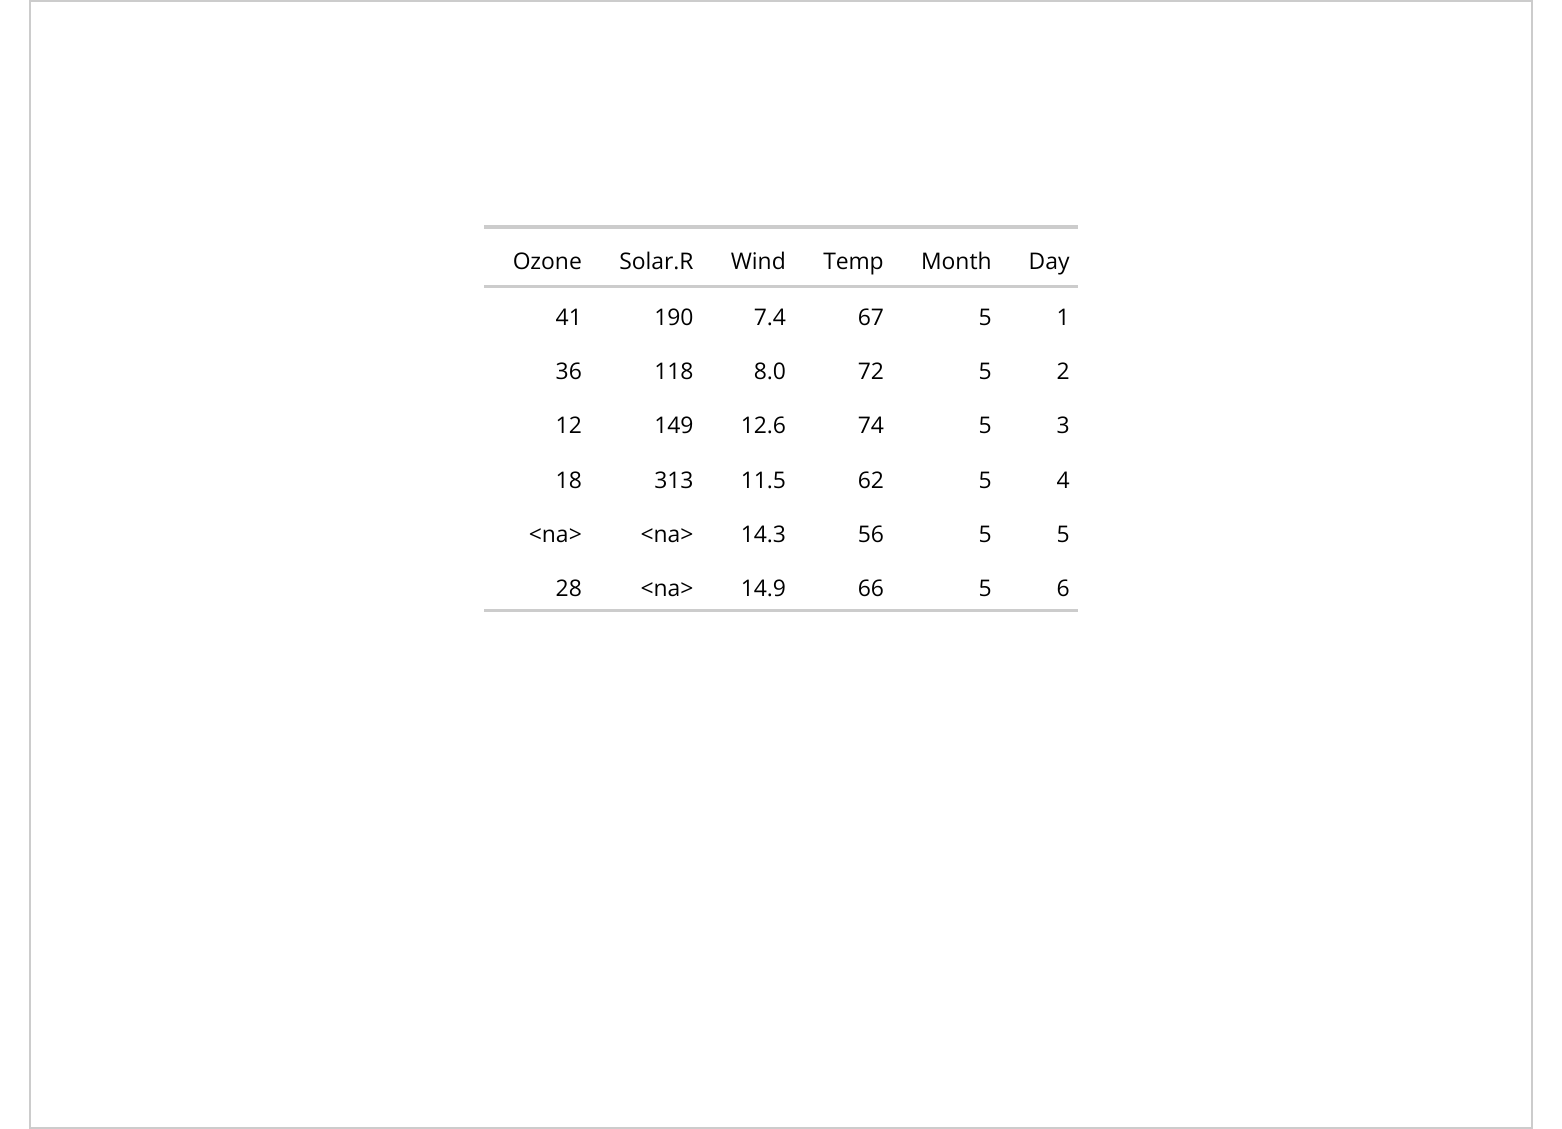
The following is producing a Word document:
read_docx() %>%
  body_add_par("A first table") %>%
  body_add_flextable(value = ft1) %>%
  body_add_par("A second table") %>%
  body_add_flextable(value = ft2) %>%
  print(target = "reports/example_table_word.docx")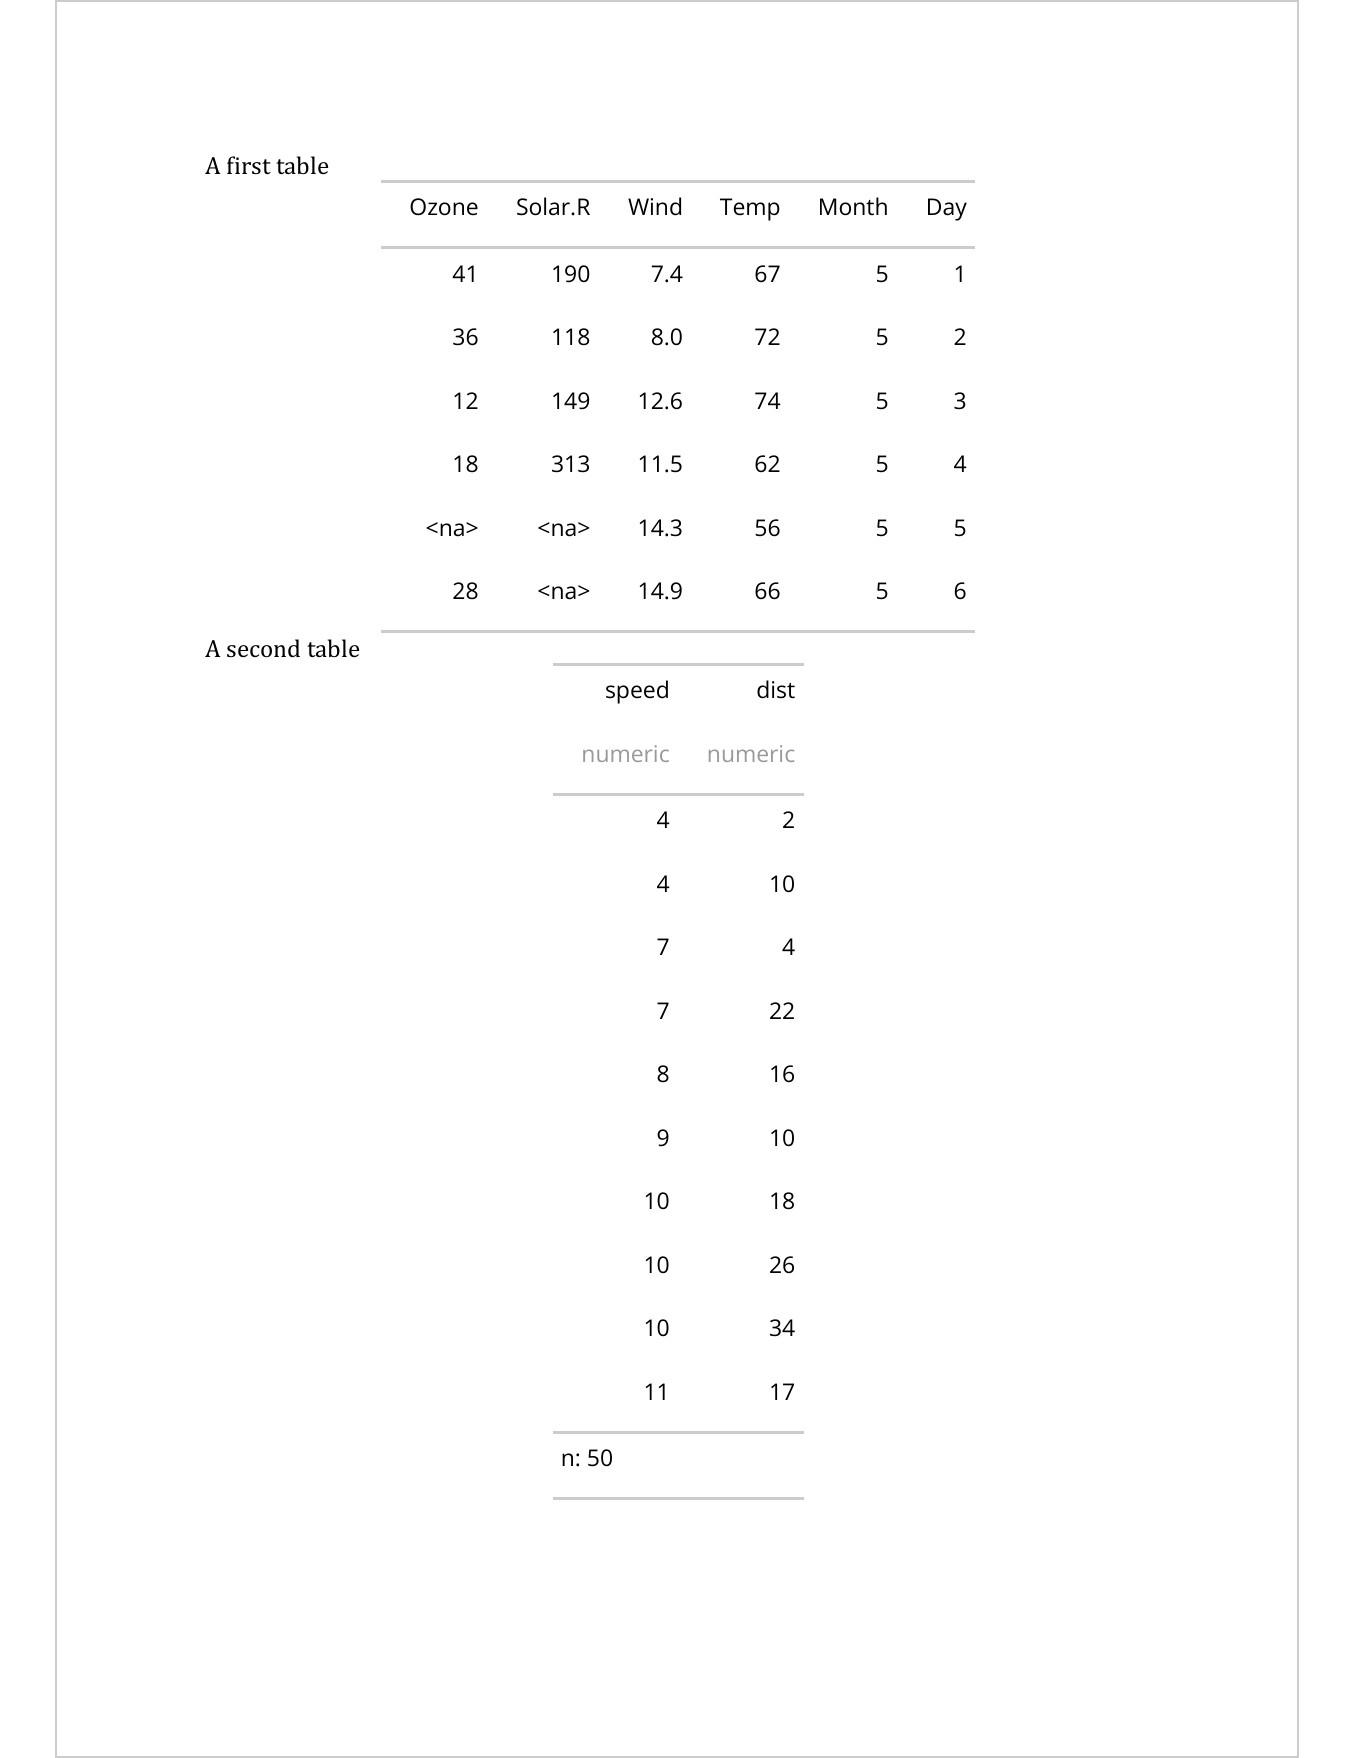
7.6 Pagination in Word and RTF
In Word and RTF documents, a large table can be split across pages in
the middle of a logical group of rows. paginate() uses the Word
“keep with next” paragraph property to prevent unwanted page breaks.
7.6.1 Small tables
For small tables, set init = TRUE so that all rows stay together
on the same page:
ft <- qflextable(head(airquality))
ft <- paginate(ft, init = TRUE, hdr_ftr = TRUE)
save_as_docx(ft, path = "reports/paginate_small.docx")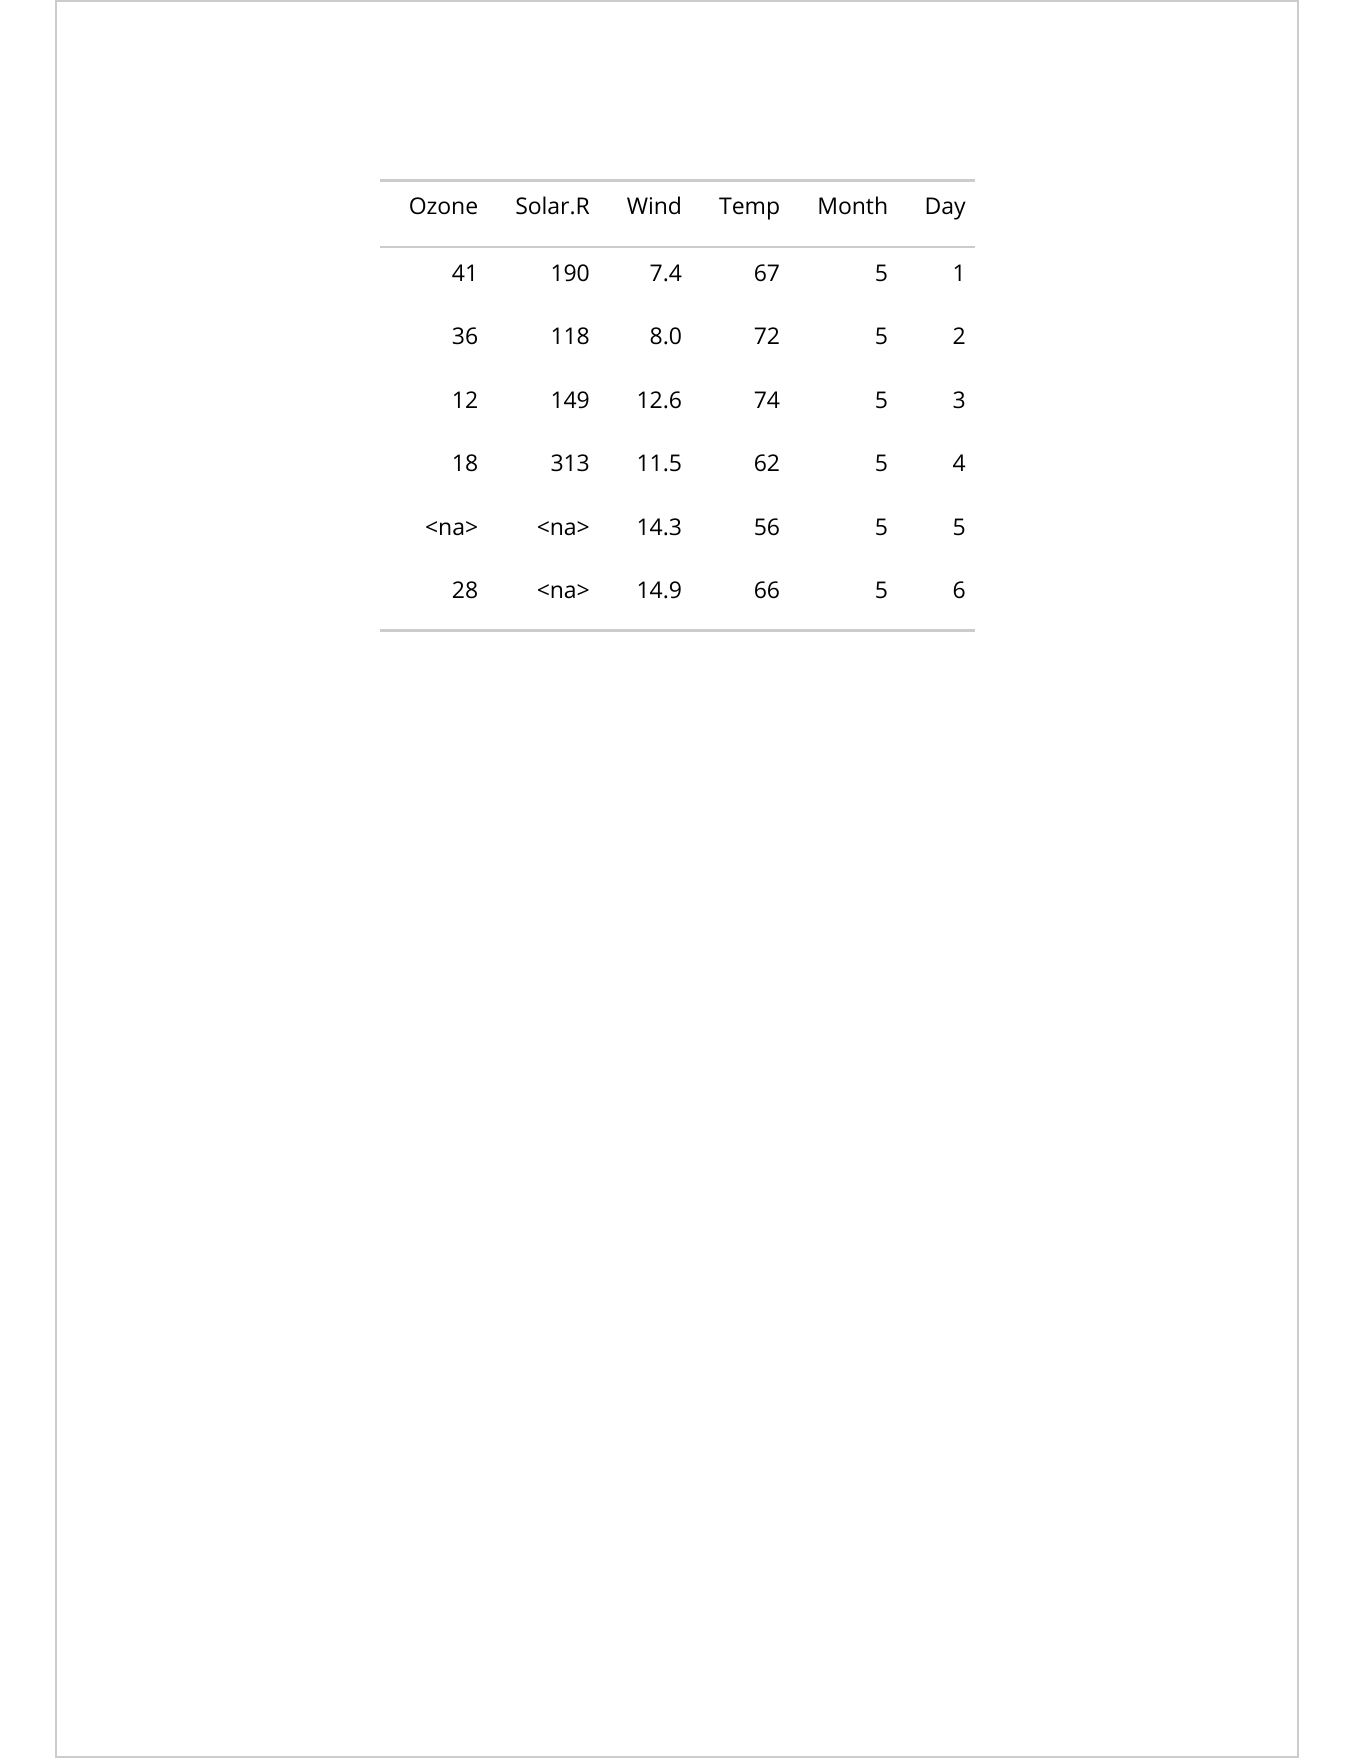
7.6.2 Large tables
For large tables, the header should stay attached to the first body row
to avoid displaying it alone at the bottom of a page.
Use init = FALSE (the default) and hdr_ftr = TRUE:
ft <- qflextable(airquality)
ft <- paginate(ft, init = FALSE, hdr_ftr = TRUE)
save_as_docx(ft, path = "reports/paginate_large.docx")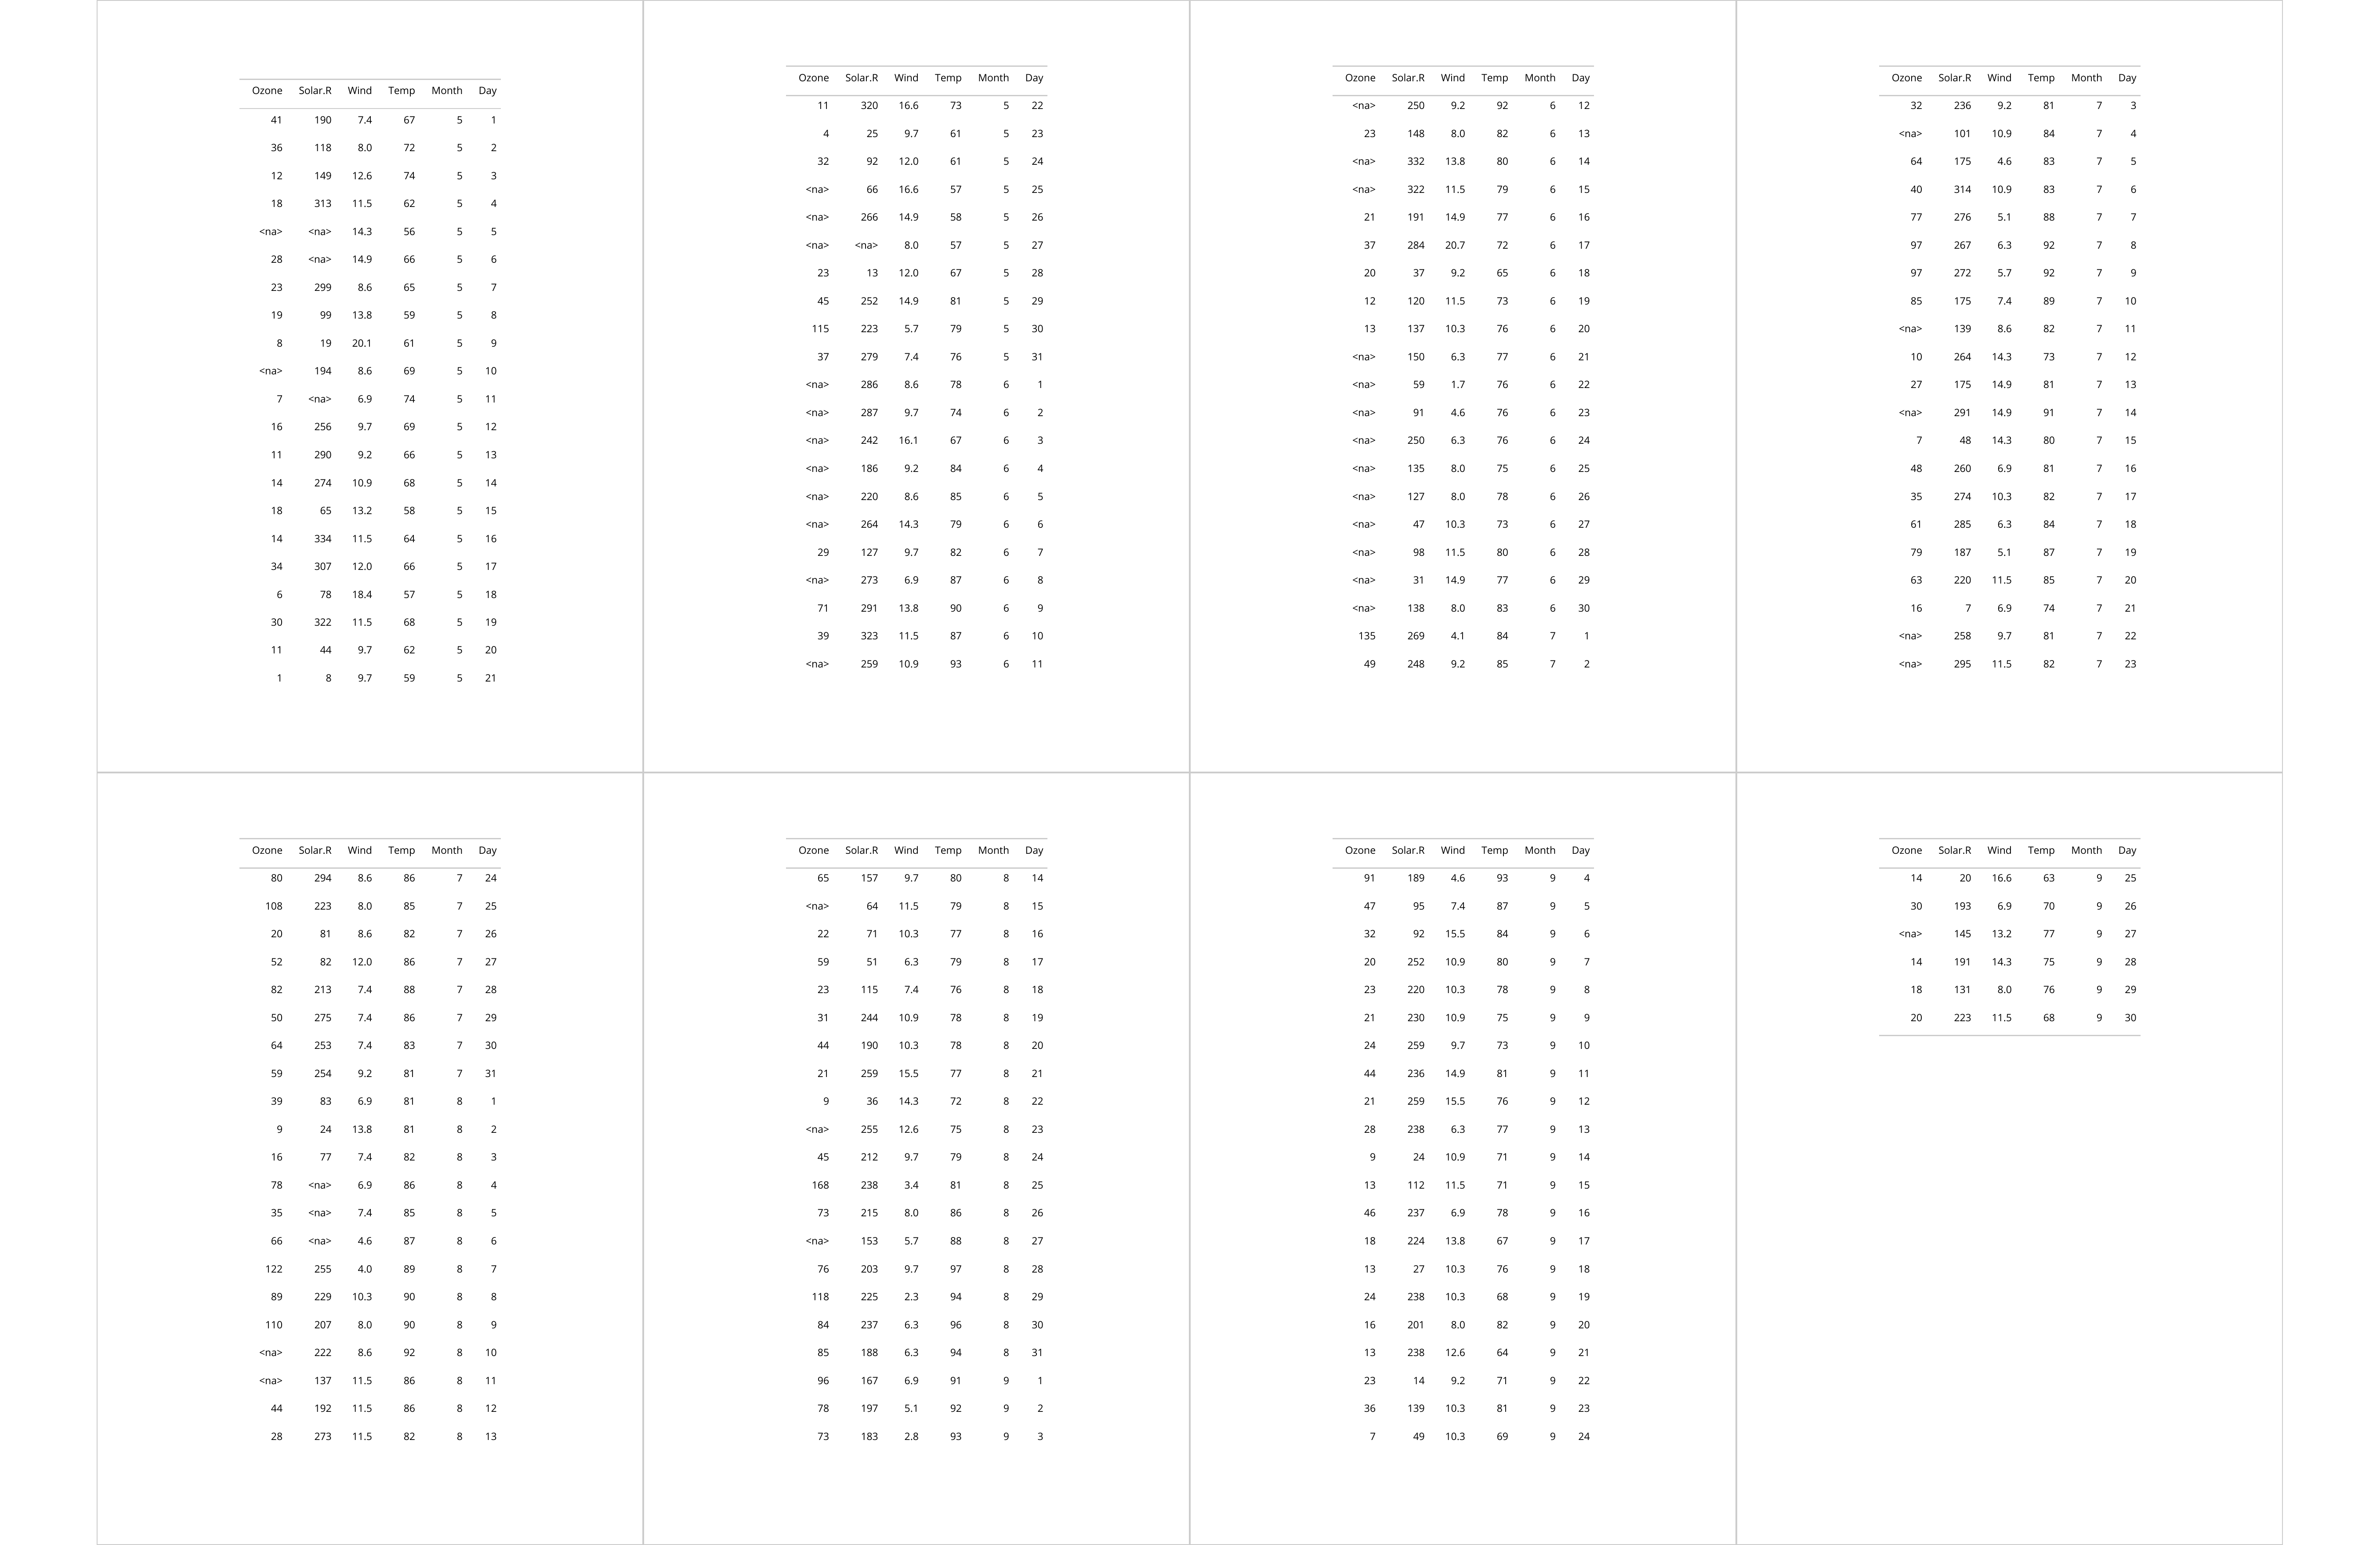
7.6.3 Header repetition across pages
By default, Word repeats the header rows at the top of each page a table
spans. To disable this behavior, set repeat_headers = FALSE with
set_table_properties():
ft <- set_table_properties(ft, opts_word = list(repeat_headers = FALSE))7.6.4 Keep groups together
When a table displays grouped data, use the group argument to
keep rows of the same group on the same page. The group_def
argument specifies the algorithm used to detect groups:
-
"rle": runs of equal values define a group. Use withtabulator()outputs. -
"nonempty": each non-empty value starts a new group. Use withas_flextable.tabular()outputs. -
"starts":groupis an integer vector of body row indices where new groups begin; page breaks are allowed before these rows. Use it when group boundaries are known explicitly rather than derived from a column.
7.6.4.1 Simple example with group_def = "rle"
data.frame(
  group = rep(c("A", "B", "C", "D", "E", "F", "G"), each = 5),
  value = rnorm(5 * 7)
) |>
  flextable() |>
  colformat_double() |>
  paginate(group = "group") |>
  save_as_docx(path = "reports/example_paginated.docx")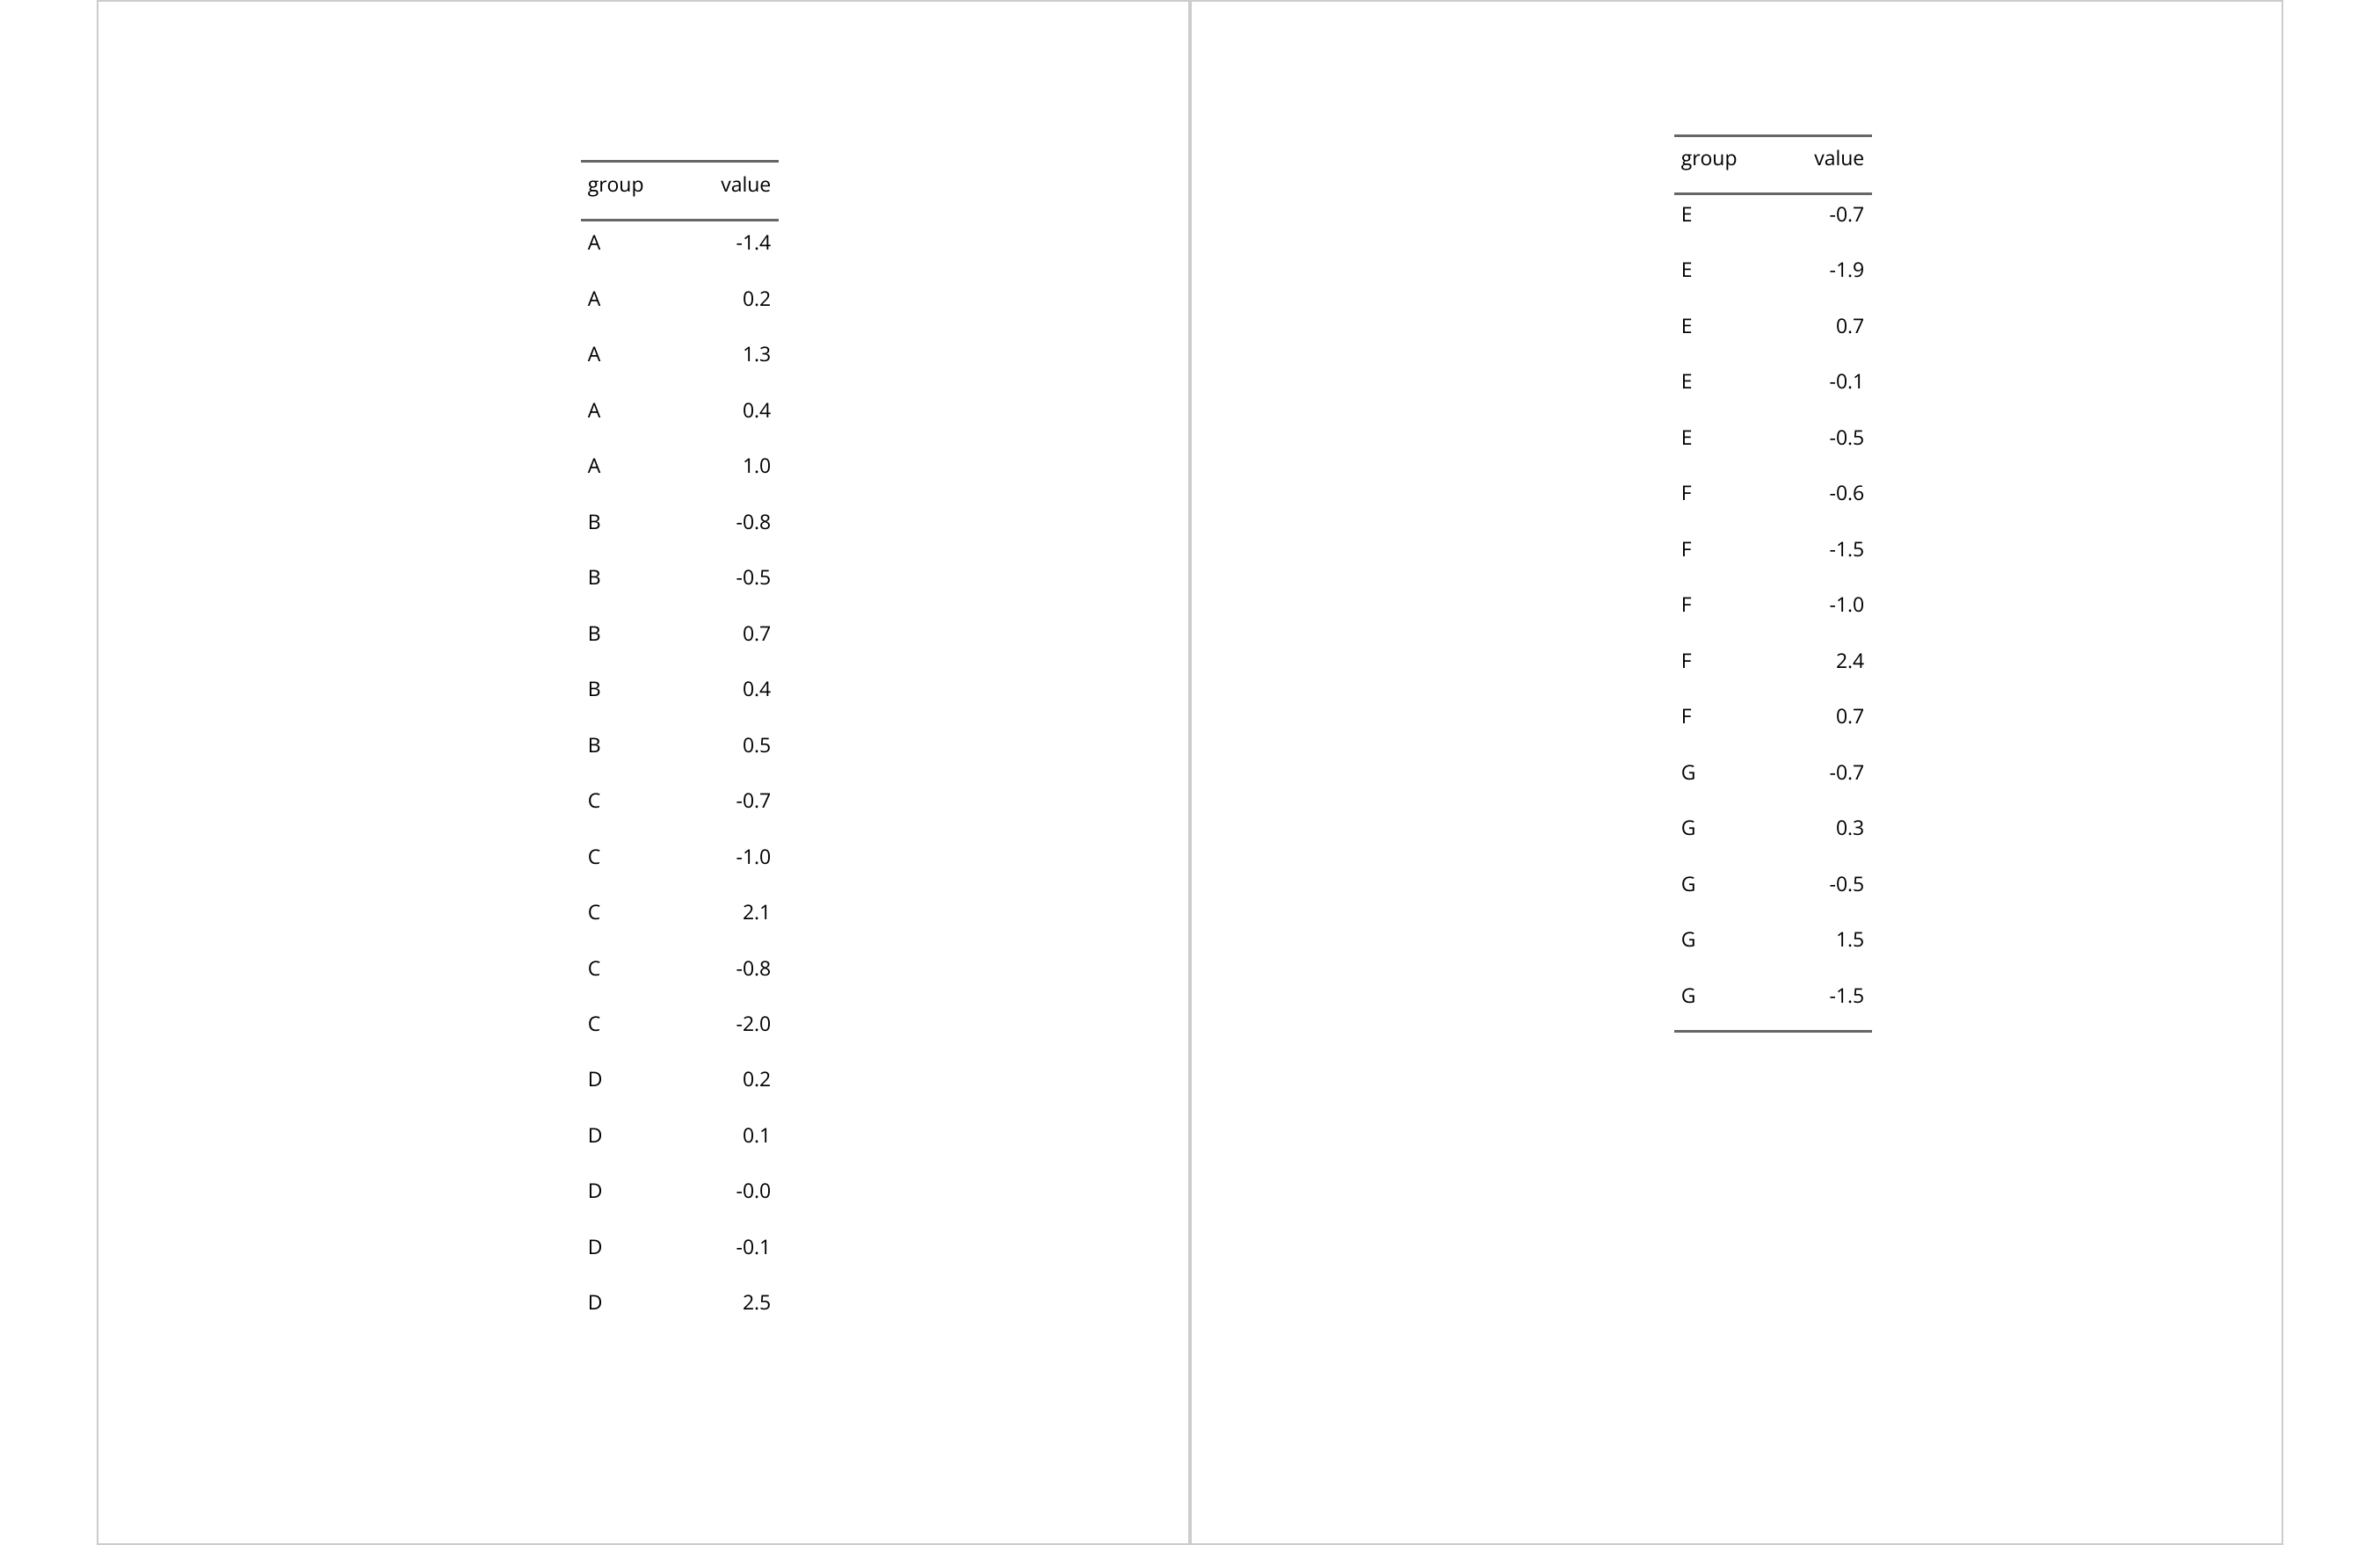
7.6.4.2 With tabulator() outputs
The following table is built with tabulator(). It is too long
to fit on a single page. Using paginate() with the first column
"cut" keeps each group of rows together.
library(dplyr)

dat <- ggplot2::diamonds |>
  filter(clarity %in% c("I1", "SI1", "VS2")) |>
  group_by(cut, color, clarity) |>
  summarise(
    across(
      .cols = all_of(c("z", "y")),
      .fns = list(
        mean = ~ mean(.x, na.rm = TRUE),
        sd = ~ sd(.x, na.rm = TRUE)
      )
    ),
    .groups = "drop"
  )

tab <- tabulator(
  x = dat, rows = c("cut", "color"),
  columns = "clarity",
  `z stats` = as_paragraph(as_chunk(fmt_avg_dev(z_mean, z_sd))),
  `y stats` = as_paragraph(as_chunk(fmt_avg_dev(y_mean, y_sd)))
)

ft <- as_flextable(tab)
ft <- paginate(ft, group = "cut", group_def = "rle")
read_docx() |>
  body_add_flextable(ft) |>
  print(target = "reports/example_tabulator_paginated.docx")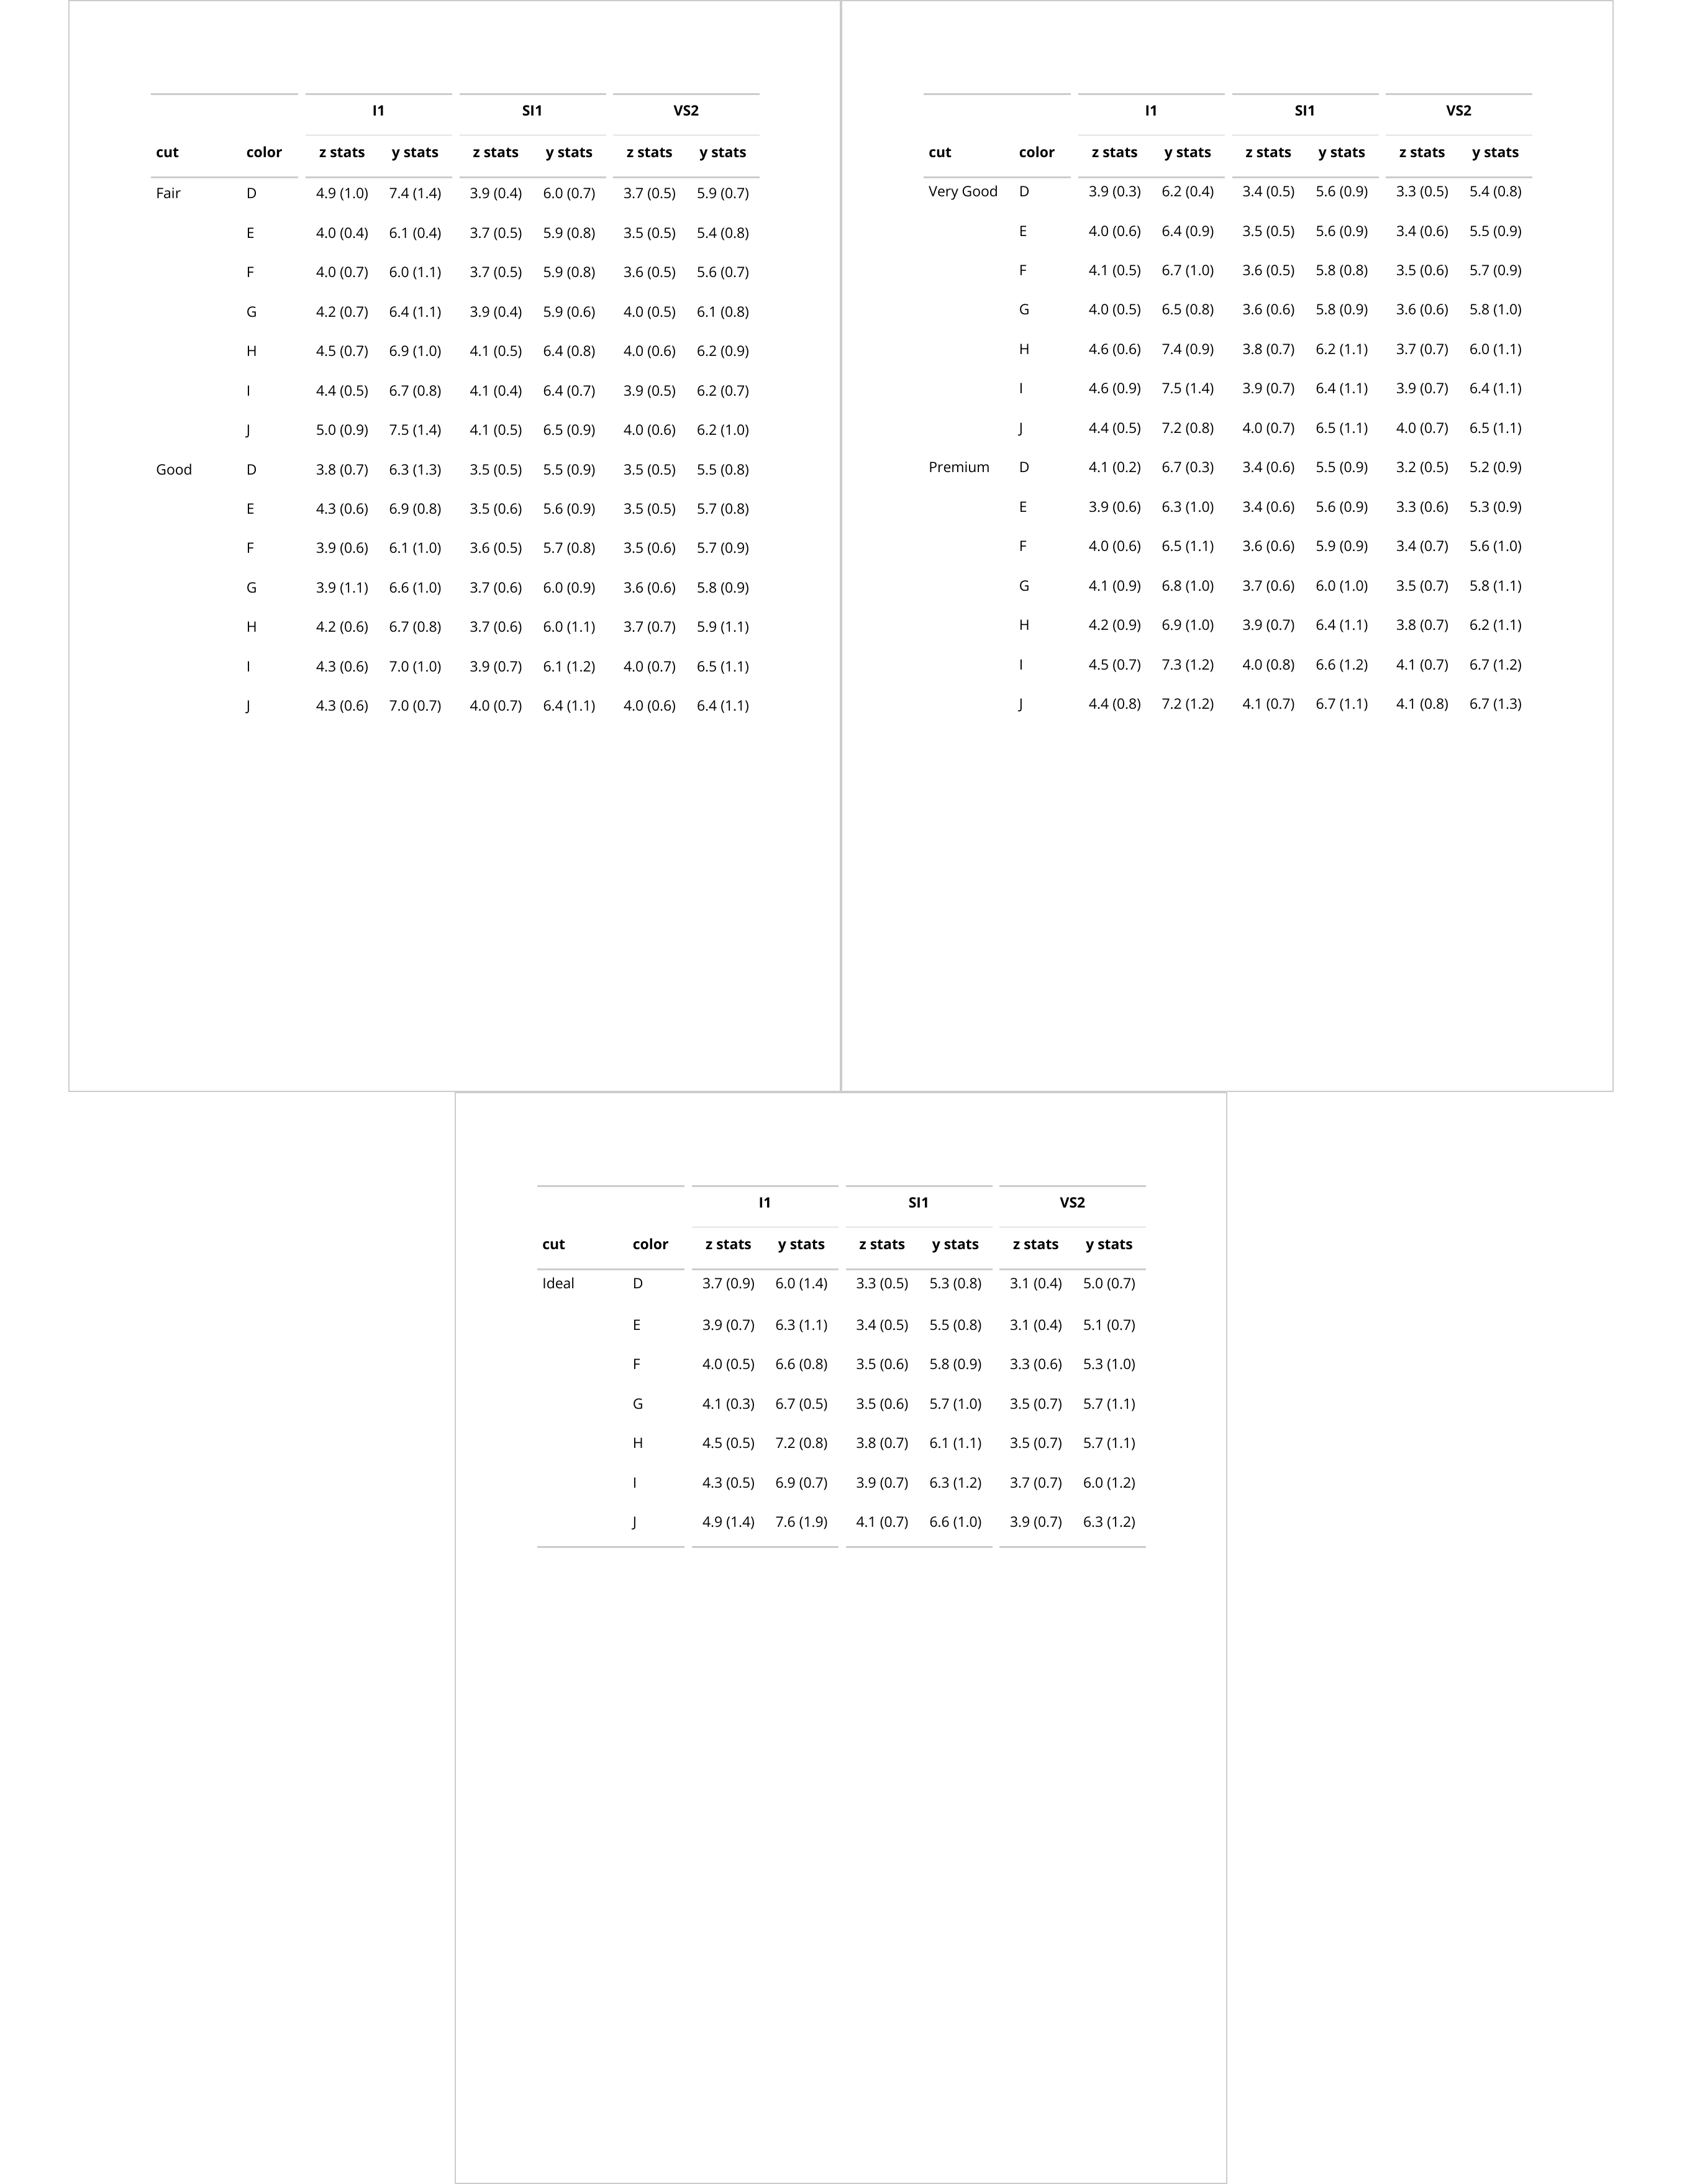
7.6.4.3 With tables::tabular() outputs
When using tables::tabular(), groups are identified by non-empty
values in a column. Use group_def = "nonempty" in this case.
library(tables)
set_flextable_defaults(theme_fun = theme_vanilla)
ft_tab <- tabular(
  cut * clarity ~ Format(digits = 2) *
    (x + y) * (mean + sd),
  data = ggplot2::diamonds
) |>
  as_flextable(
    spread_first_col = TRUE,
    row_title = as_paragraph(
      colorize("clarity: ", color = "#666666"),
      colorize(as_b(.row_title), color = "#666666")
    )
  ) |>
  paginate(init = TRUE, group = "COL1", group_def = "nonempty")

text <- paste(
  "Lorem ipsum dolor sit amet, scelerisque cras,",
  "amet dui eros ultricies leo amet.",
  "Risus urna sociis class risus.",
  "Vitae sit natoque nisi ipsum.",
  "Mauris at volutpat tempor, orci vivamus.",
  "Libero ullamcorper urna dis praesent blandit risus eget!",
  "Tempus eget enim in, proin est tempor, eget lorem.",
  "Orci suspendisse lobortis purus aptent nec nulla tincidunt",
  "vitae ipsum facilisis lacinia semper primis."
)

read_docx() |>
  body_add_par(text) |>
  body_add_par(text) |>
  body_add_flextable(ft_tab) |>
  print(target = "reports/example_tabular_paginated.docx")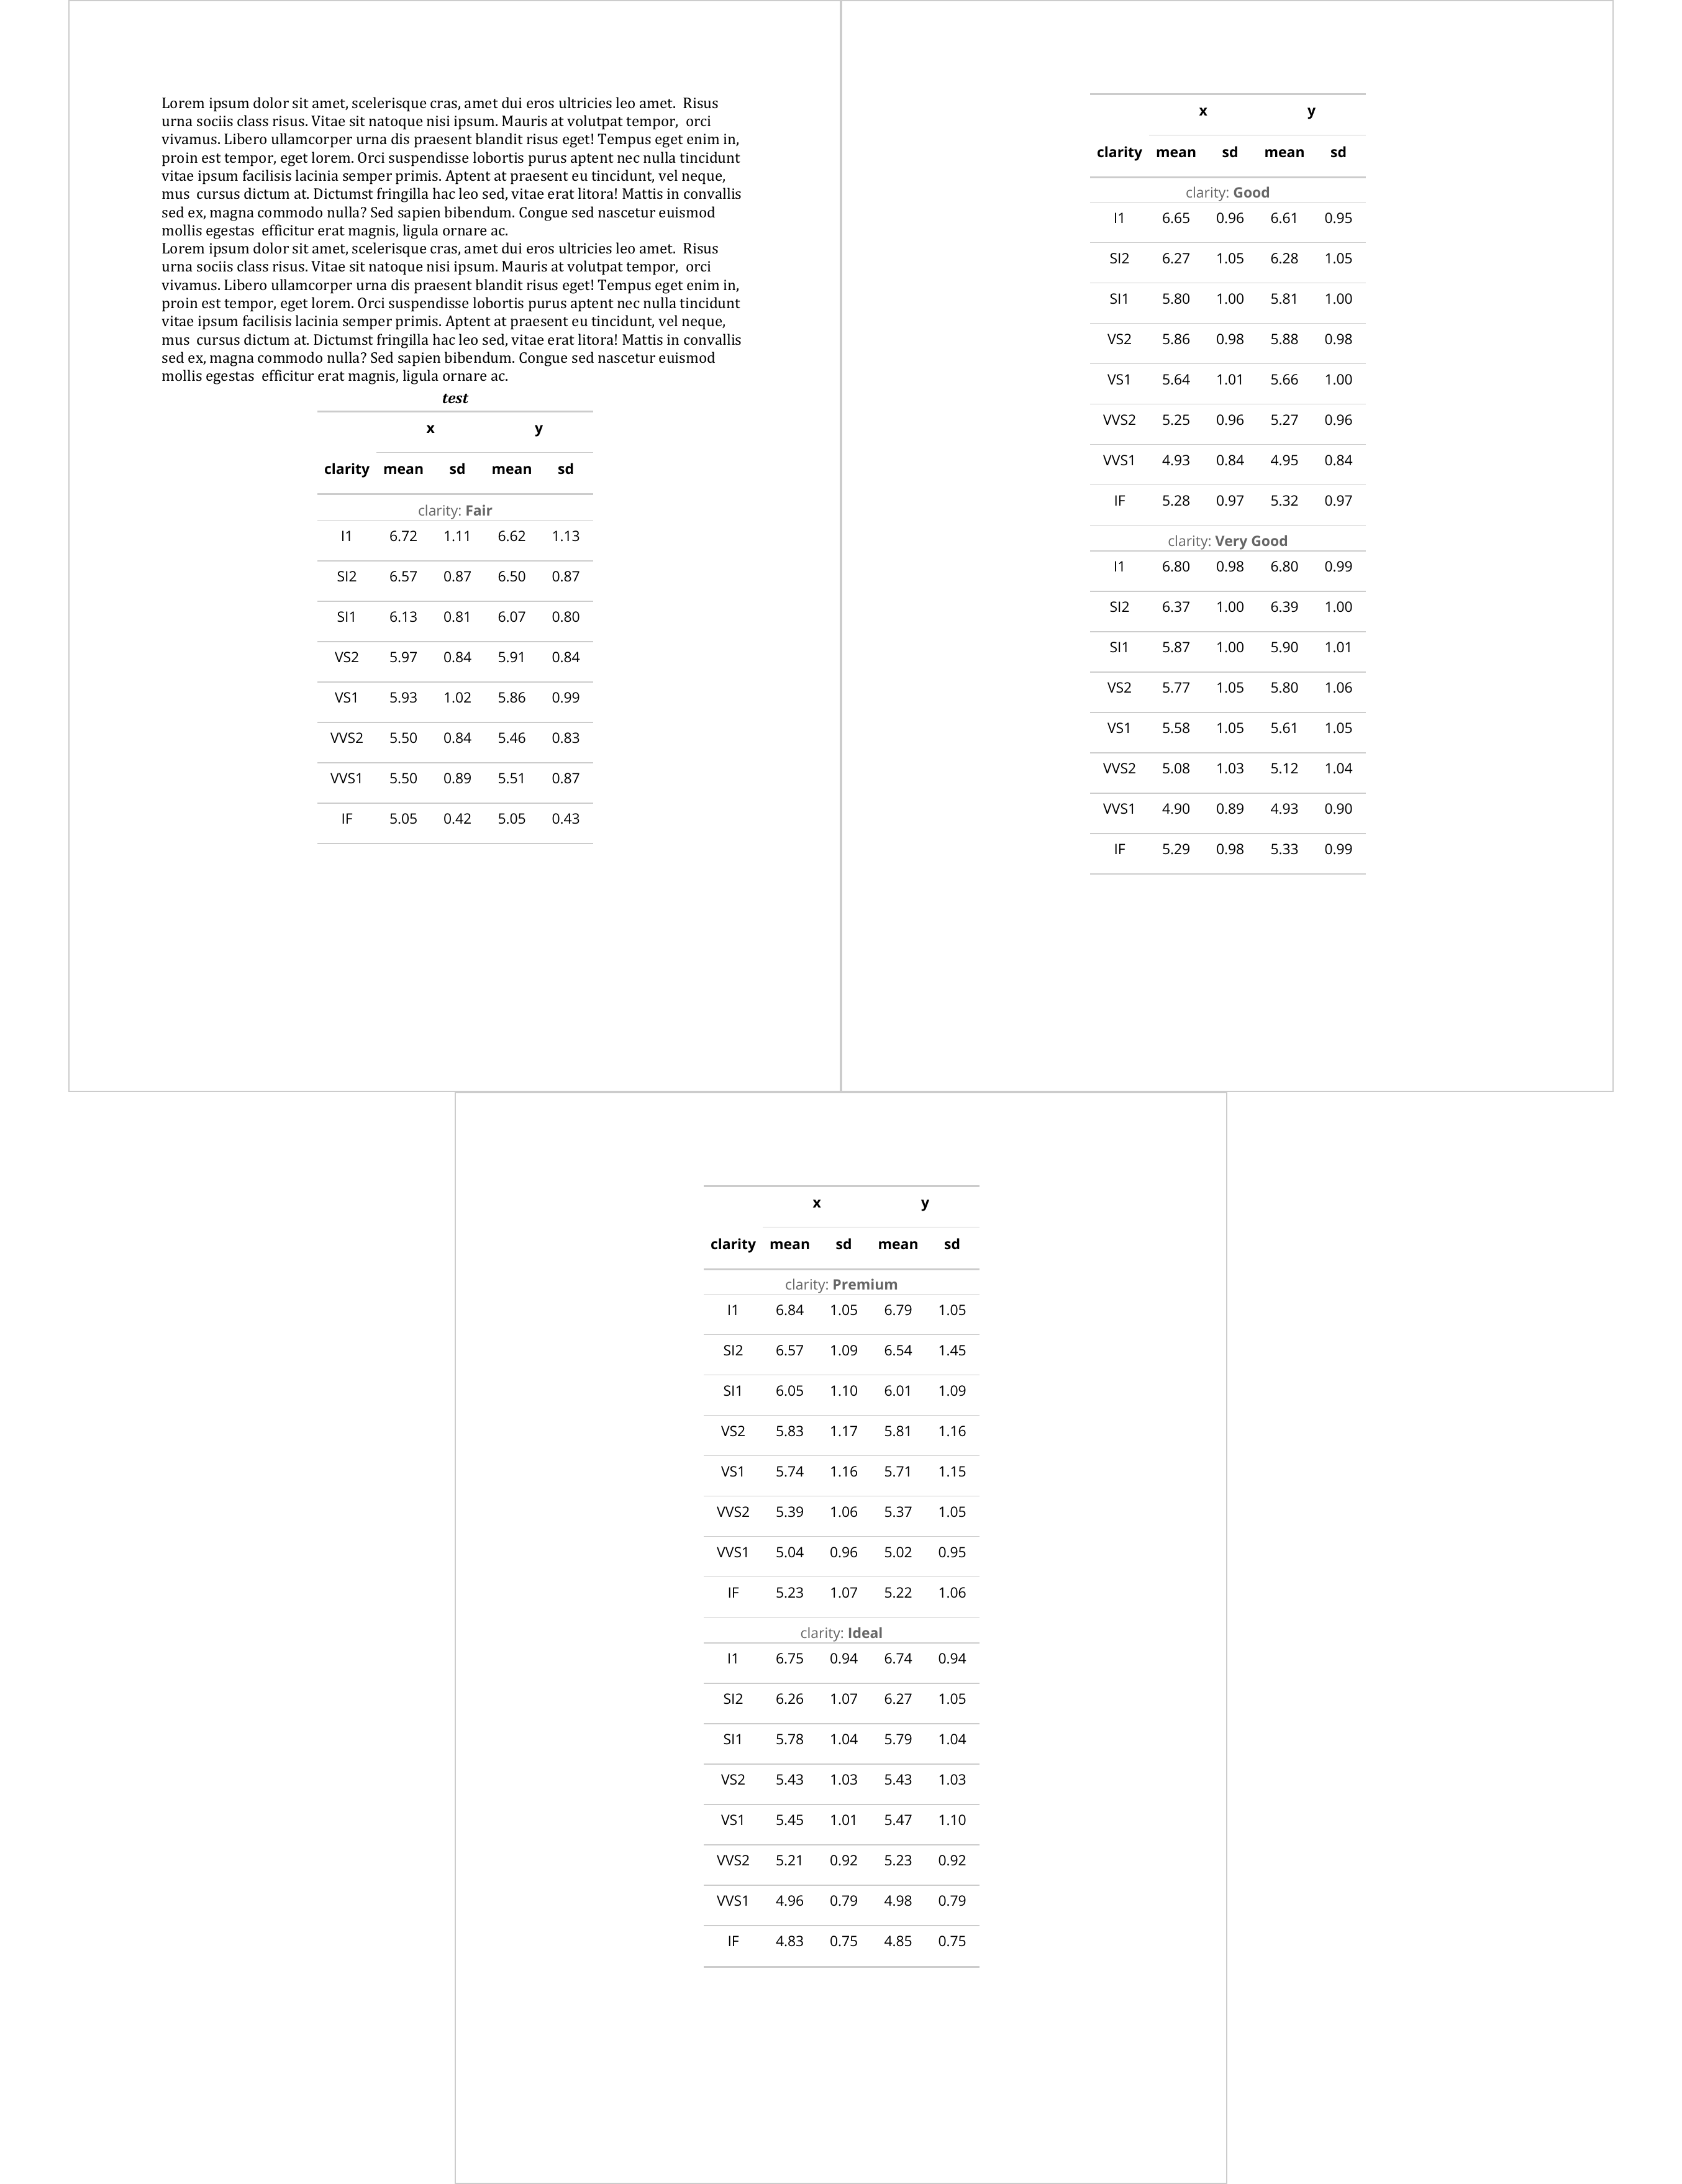
The call paginate(init = TRUE, group = "COL1", group_def = "nonempty") can be
read as: paginate the table and make sure that groups defined by new non-empty
values in column "COL1" 2 are displayed on the same page when possible.
7.7 Splitting a flextable into several flextables
paginate() controls page breaks within a single table. When a table is
too wide or too tall to fit at all, you can instead split it into a list
of smaller flextables, each sized to fit a given width or height. This is
useful for Word and PowerPoint output, where a table cannot overflow the
page.
split_columns() splits by columns so each piece fits within max_width.
The rep_cols argument repeats identifying columns on every piece.
ft <- qflextable(head(mtcars))
parts <- split_columns(ft, max_width = 4, rep_cols = "mpg")
length(parts)
# [1] 2
parts[[1]]mpg |
cyl |
disp |
hp |
drat |
wt |
qsec |
vs |
am |
|---|---|---|---|---|---|---|---|---|
21.0 |
6 |
160 |
110 |
3.90 |
2.620 |
16.46 |
0 |
1 |
21.0 |
6 |
160 |
110 |
3.90 |
2.875 |
17.02 |
0 |
1 |
22.8 |
4 |
108 |
93 |
3.85 |
2.320 |
18.61 |
1 |
1 |
21.4 |
6 |
258 |
110 |
3.08 |
3.215 |
19.44 |
1 |
0 |
18.7 |
8 |
360 |
175 |
3.15 |
3.440 |
17.02 |
0 |
0 |
18.1 |
6 |
225 |
105 |
2.76 |
3.460 |
20.22 |
1 |
0 |
parts[[2]]mpg |
gear |
carb |
|---|---|---|
21.0 |
4 |
4 |
21.0 |
4 |
4 |
22.8 |
4 |
1 |
21.4 |
3 |
1 |
18.7 |
3 |
2 |
18.1 |
3 |
1 |
split_rows() splits by rows so each piece fits within max_height
(header and footer are repeated on every piece). The group argument is
an integer vector of body row indices that start a new group; rows of the
same group are never split across two pieces.
parts <- split_rows(ft, max_height = 3)split_to_pages() combines both directions in a single call (rows are
split first, then columns within each row page):
parts <- split_to_pages(ft, max_width = 4, max_height = 5, rep_cols = "mpg")Each element of the returned list is a regular flextable that can be added
to a document, for example with save_as_docx() or in a loop over the
list.
Footnotes are currently repeated on every piece produced by
split_rows(), even when they reference rows on another page.
7.8 Using within shiny applications
Use function htmltools_value() to get the HTML value of the
flextable. This value is suitable for an shiny::uiOutput().
library(shiny)
library(flextable)
library(dplyr)

dat <- mtcars %>%
  mutate(car = rownames(.)) %>%
  select(car, everything())

ui <- fluidPage(
  titlePanel("mtcars"),
  sidebarLayout(
    sidebarPanel(
      sliderInput("mpg", "mpg Limit", min = 11, max = 33, value = 20)
    ),
    mainPanel(uiOutput("mtcars_ft"))
  )
)

server <- function(input, output) {
  output$mtcars_ft <- renderUI({
    req(input$mpg)
    filter(dat, mpg <= input$mpg) %>%
      flextable() %>%
      theme_vader() %>%
      autofit() %>%
      htmltools_value()
  })
}

# Run the application
shinyApp(ui = ui, server = server)
7.9 Automatic printing of data.frame as flextable
The package is providing an S3 method to automatically print R data.frame as
flextables. All you need is to call use_df_printer() in an R code chunk. It
will register df_print() as the method to use for printing data.frames.
df_print() creates a summary from a data.frame as a flextable. It displays
first lines and shows column types. In addition to usual knitr chunk options, the
following options are also available:
-
ft_max_row: The number of rows to print. Default is 10. -
ft_split_colnames: Should the column names be split (with non alpha-numeric characters). Default is FALSE. -
ft_short_strings: Should the character column be shortened. Default is FALSE. -
ft_short_size: Maximum length of character column ifft_short_stringsis TRUE. Default is 35. -
ft_short_suffix: Suffix to add when character values are shortened. Default is “…”. -
ft_do_autofit: Use autofit() before rendering the table. Default is TRUE. -
ft_show_coltype: Show column types. Default is TRUE. -
ft_color_coltype: Color to use for column types. Default is “#999999”.
The chapter B presenting the example datasets
is an illustration of use_df_printer() usage.
---
output: word_document
---

```{r setup, include=FALSE}
knitr::opts_chunk$set(echo = FALSE, ft_max_row = 6, tab.topcaption=FALSE, ft.align="left")
library(flextable)
set_flextable_defaults(font.size = 11, padding = 3)
use_df_printer()
```

This is blah blah blah.

```{r tab.cap="cars"}
cars
```

This is blah blah blah.

```{r tab.cap="airquality"}
airquality
```
HTML, Word, PowerPoint and PDF outputs are managed with method
knitr::knit_print. For markdown output, an image is used.↩︎as_flextable()creates column keys named COL1, COL2, COL3, etc.↩︎