Chapter 7 officer for PowerPoint
The main functions for PowerPoint generation are presented below:

7.1 Add slides
You can’t add any content if there is no slide in the presentation.
To add a new slide, use the function add_slide(). It requires 3 arguments:
- an rpptx object
- a slide layout name
- a master layout name
my_pres <- read_pptx()
my_pres <- add_slide(my_pres, layout = "Title and Content", master = "Office Theme")
The values of the “layout” and “master” arguments must match the values provided in the initial document.
Layout names and master layout names are not easily readable within
PowerPoint, but these can be read easily with the function layout_summary().
layout | master |
|---|---|
character | character |
Title Slide | Office Theme |
Title and Content | Office Theme |
Section Header | Office Theme |
Two Content | Office Theme |
Comparison | Office Theme |
Title Only | Office Theme |
Blank | Office Theme |
n: 7 | |
If most slides of your presentation share the same layout, repeating the
layout (and master) arguments on every add_slide() call is noisy.
layout_default() sets a default layout at the presentation level;
subsequent add_slide() calls with no explicit layout use it.
my_pres <- read_pptx() |>
  layout_default(layout = "Title and Content", master = "Office Theme")

my_pres <- my_pres |>
  add_slide() |>
  add_slide() |>
  add_slide(layout = "Two Content")
Individual add_slide() calls can still override the default by passing
their own layout, as on the third slide above.
7.2 Add content to a slide
Content must be placed on a slide in a new shape.
ph_with() is the unique function you should have to use to add content
to a slide. It has 3 arguments:
- the
rpptxobject, - the object to be printed
- and the location that define the placeholder where shape will be created.
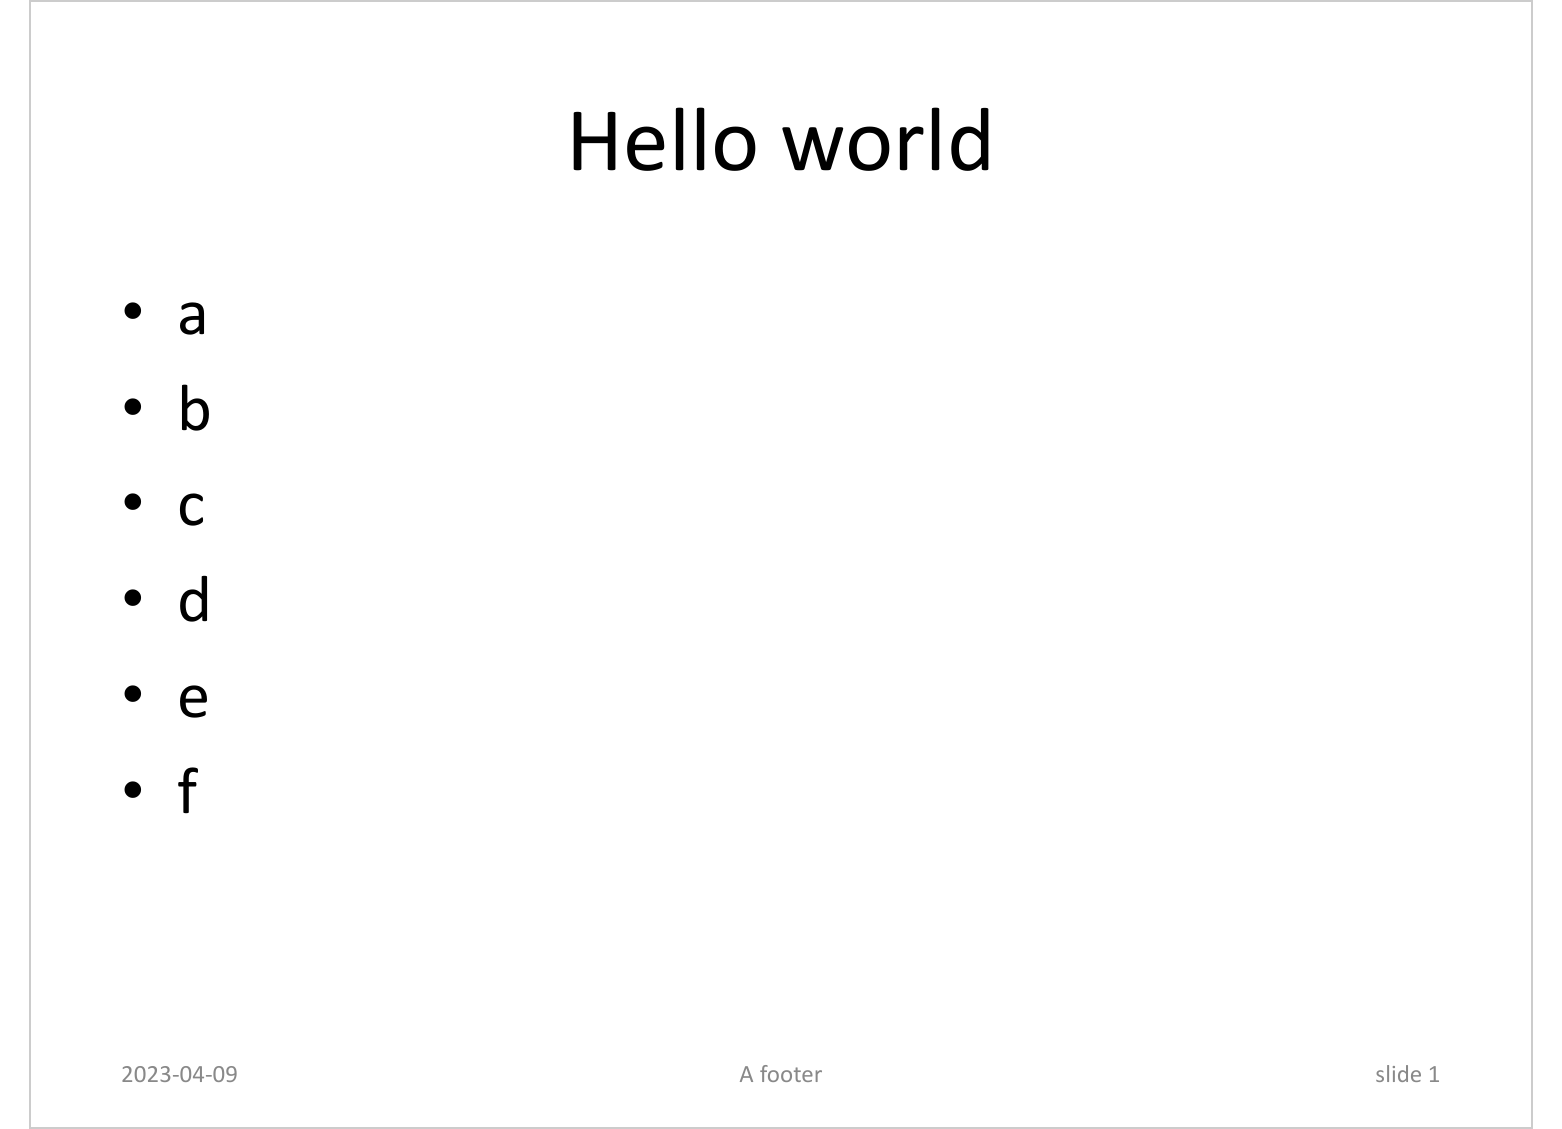
my_pres <- ph_with(my_pres, value = "Hello world", location = ph_location_type(type = "title"))
my_pres <- ph_with(my_pres, value = "A footer", location = ph_location_type(type = "ftr"))
my_pres <- ph_with(my_pres, value = Sys.Date(), location = ph_location_type(type = "dt"))
my_pres <- ph_with(my_pres, value = "slide 1", location = ph_location_type(type = "sldNum"))
my_pres <- ph_with(my_pres, value = head(letters), location = ph_location_type(type = "body"))
7.3 Write the PowerPoint file
The (updated) Powerpoint file can be generated using the print() function
along with the target argument:
7.4 Content location
The function ph_with() is expecting an argument location that will be used
to specify the location of the new shape.
This argument must be an object created from a call to one of the ph_location*
functions (placeholder location):
ph_location_type(): uses the location and properties of the shape identified in the layout with itstypevalue.ph_location_fullsize(): full-page location, mainly for graphicsph_location_label(): uses the location and properties of a shape present in the layout identified by its label.ph_location_left(): uses the location and properties of the “body” typed shape located on left of the layout named “Two Contents”.ph_location_right(): uses the location and properties of the “body” typed shape located on right of the layout named “Two Contents”.ph_location(): allows to freely define the location and some properties such as background color and rotation angle.ph_location_template(): allows to freely define the location but inherits properties from a shape identified in the layout with itstypevalue.
Each of these functions have an argument newlabel that can be used to associate a label
to a new shape. It makes easy then to identify that shape and manipulate it, see Slide selection and manipulation.
7.4.1 Match with the type of shape
The following code adds text “Hello world” in a new shape.
That shape will inherit its properties from the shape that has
type body in the layout associated with the current slide.
i.e. Title and Content in our example.
doc <- read_pptx()
doc <- add_slide(doc, layout = "Title and Content")
doc <- ph_with(doc, c("Hello world", "Bonjour monde", "Blah blah blah"),
          location = ph_location_type(type = "body") )

print(doc, target = "static/office/ph_with_location_type.pptx") 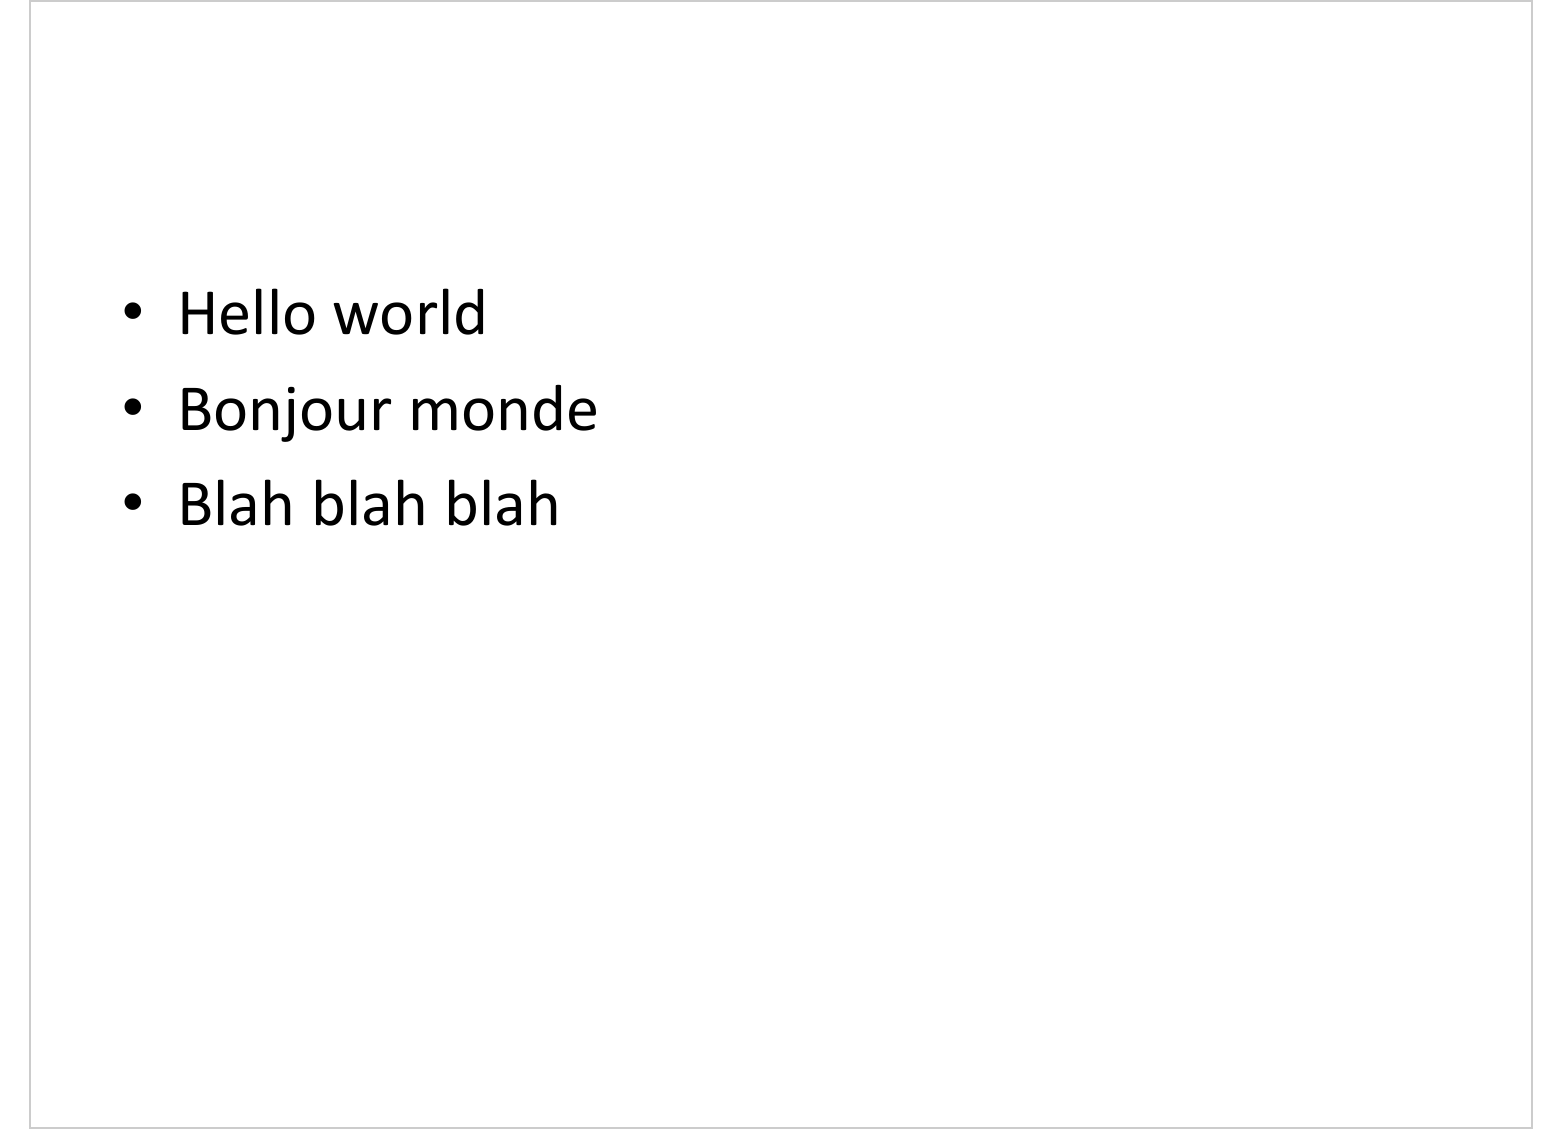
7.4.2 Match with the label of shape
The following example will print few rows of iris data.frame in a new shape. That shape will inherit its properties from the shape that has label Content Placeholder 2 in the layout associated with the current slide.
mypres <- read_pptx()
mypres <- add_slide(mypres, layout = "Title and Content")
layout_properties ( x = mypres, layout = "Title and Content" )
master_name | name | type | type_idx | id | ph_label | ph | offx | offy | cx | cy | rotation | fld_id | fld_type |
|---|---|---|---|---|---|---|---|---|---|---|---|---|---|
character | character | character | numeric | integer | character | character | numeric | numeric | numeric | numeric | numeric | character | character |
Office Theme | Title and Content | title | 1 | 2 | Title 1 | <p:ph type="title"/> | 0.5 | 0.3 | 9.0 | 1.2 | |||
Office Theme | Title and Content | body | 1 | 3 | Content Placeholder 2 | <p:ph idx="1"/> | 0.5 | 1.8 | 9.0 | 4.9 | |||
Office Theme | Title and Content | dt | 1 | 4 | Date Placeholder 3 | <p:ph type="dt" sz="half" idx="10"/> | 0.5 | 7.0 | 2.3 | 0.4 | {E6744CE3-0875-4B69-89C0-6F72D8139561} | datetimeFigureOut | |
Office Theme | Title and Content | ftr | 1 | 5 | Footer Placeholder 4 | <p:ph type="ftr" sz="quarter" idx="11"/> | 3.4 | 7.0 | 3.2 | 0.4 | |||
Office Theme | Title and Content | sldNum | 1 | 6 | Slide Number Placeholder 5 | <p:ph type="sldNum" sz="quarter" idx="12"/> | 7.2 | 7.0 | 2.3 | 0.4 | {8DADB20D-508E-4C6D-A9E4-257D5607B0F6} | slidenum | |
n: 5 | |||||||||||||
This is the same location that is used in the previous example
but identified with function ph_location_label(). A title is
also added.
mypres <- ph_with(mypres, head(iris),
  location = ph_location_label(
    ph_label = "Content Placeholder 2") )

print(mypres, target = "static/office/ph_with_location_1.pptx") 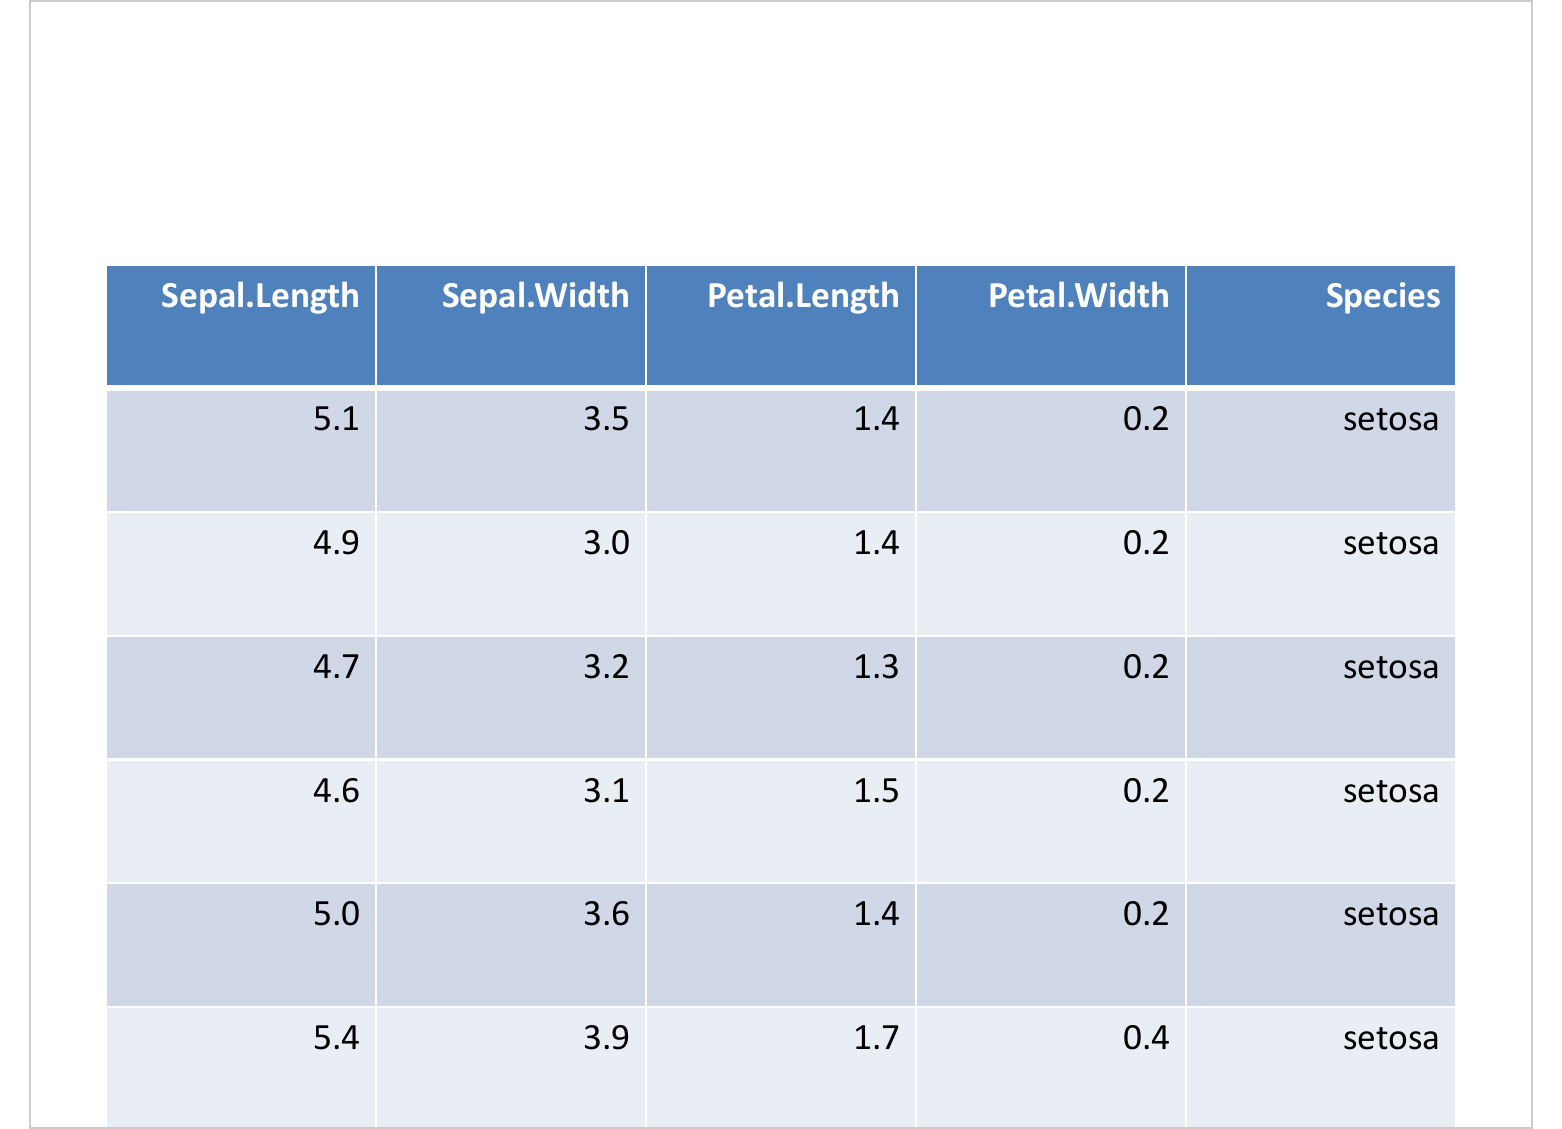
7.4.3 Two columns layout
This example add a new slide with layout “Two Content” and prints sets of paragraphs of text in two new shapes, one representing the left side and one representing the right side.
mypres <- add_slide(mypres, layout = "Two Content")
mypres <- ph_with(mypres, sprintf("text item #%d", 1:6),
          location = ph_location_left())
mypres <- ph_with(mypres, sprintf("text item #%d", 7:12),
          location = ph_location_right())

print(mypres, target = "static/office/ph_with_location_2.pptx") 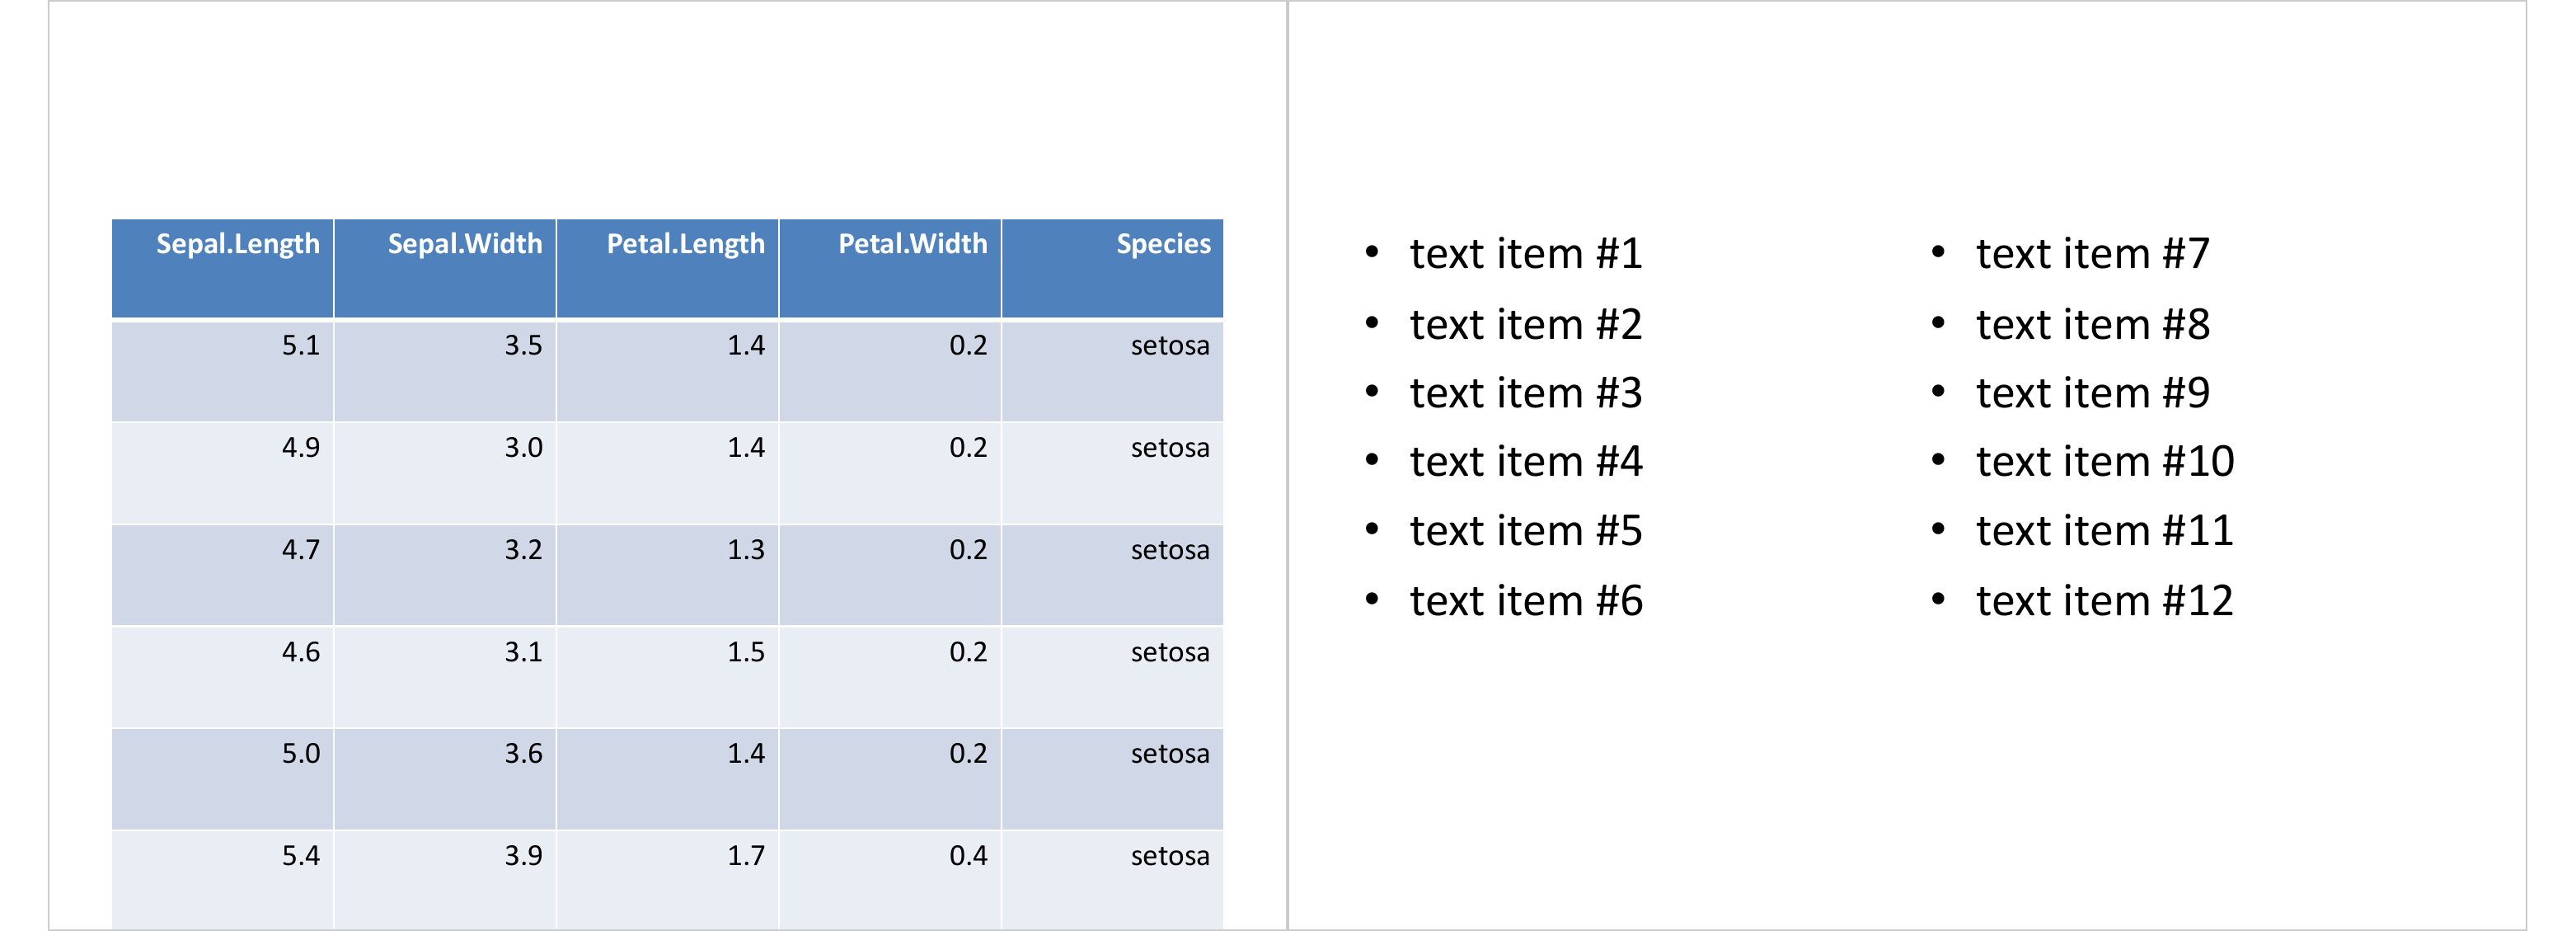
7.4.4 Free location and properties
Function ph_location() lets you freely define the location and few properties:
paragraph <- fpar(ftext("Hello world", fp_text(color = "white", font.size = 40)))

free_loc <- ph_location(
  left = 2, top = 1.5,
  width = 4.5, height = 4.5,
  rotation = 45, bg = "black")

mypres <- read_pptx()
mypres <- add_slide(mypres, layout = "Title and Content")
mypres <- ph_with(mypres, paragraph,
  location = free_loc )
print(mypres, target = "static/office/ph_with_location_3.pptx") 
7.4.5 Free location inherits properties
Function ph_location() lets you freely define the location but inherits properties from a shape identified in the layout with its type value.
mypres <- read_pptx("templates/template_demo.pptx")
layout_properties(mypres, layout = "Custom Slide")
master_name | name | type | type_idx | id | ph_label | ph | offx | offy | cx | cy | rotation | fld_id | fld_type |
|---|---|---|---|---|---|---|---|---|---|---|---|---|---|
character | character | character | numeric | integer | character | character | numeric | numeric | numeric | numeric | numeric | character | character |
Office Theme | Custom Slide | title | 1 | 2 | Title 1 | <p:ph type="title"/> | 0.5 | 0.3 | 9.0 | 1.2 | |||
Office Theme | Custom Slide | body | 1 | 3 | Content Placeholder 2 | <p:ph idx="1"/> | 0.5 | 1.8 | 9.0 | 4.9 | |||
Office Theme | Custom Slide | body | 2 | 7 | message | <p:ph idx="13" hasCustomPrompt="1"/> | 0.1 | 3.1 | 9.8 | 1.2 | 326 | ||
Office Theme | Custom Slide | dt | 1 | 4 | Date Placeholder 3 | <p:ph type="dt" sz="half" idx="10"/> | 0.9 | 7.0 | 2.0 | 0.4 | {E6744CE3-0875-4B69-89C0-6F72D8139561} | datetimeFigureOut | |
Office Theme | Custom Slide | ftr | 1 | 5 | Footer Placeholder 4 | <p:ph type="ftr" sz="quarter" idx="11"/> | 3.4 | 7.0 | 3.2 | 0.4 | |||
Office Theme | Custom Slide | sldNum | 1 | 6 | Slide Number Placeholder 5 | <p:ph type="sldNum" sz="quarter" idx="12"/> | 7.2 | 7.0 | 2.3 | 0.4 | {8DADB20D-508E-4C6D-A9E4-257D5607B0F6} | slidenum | |
n: 6 | |||||||||||||
free_loc <- ph_location_template(
  top = 3, type = "body", id = 1,
  width = 8, height = 1)

mypres <- add_slide(mypres, layout = "Custom Slide")
mypres <- ph_with(mypres, "this is a custom message",
  location = free_loc )
print(mypres, target = "static/office/ph_with_location_4.pptx") 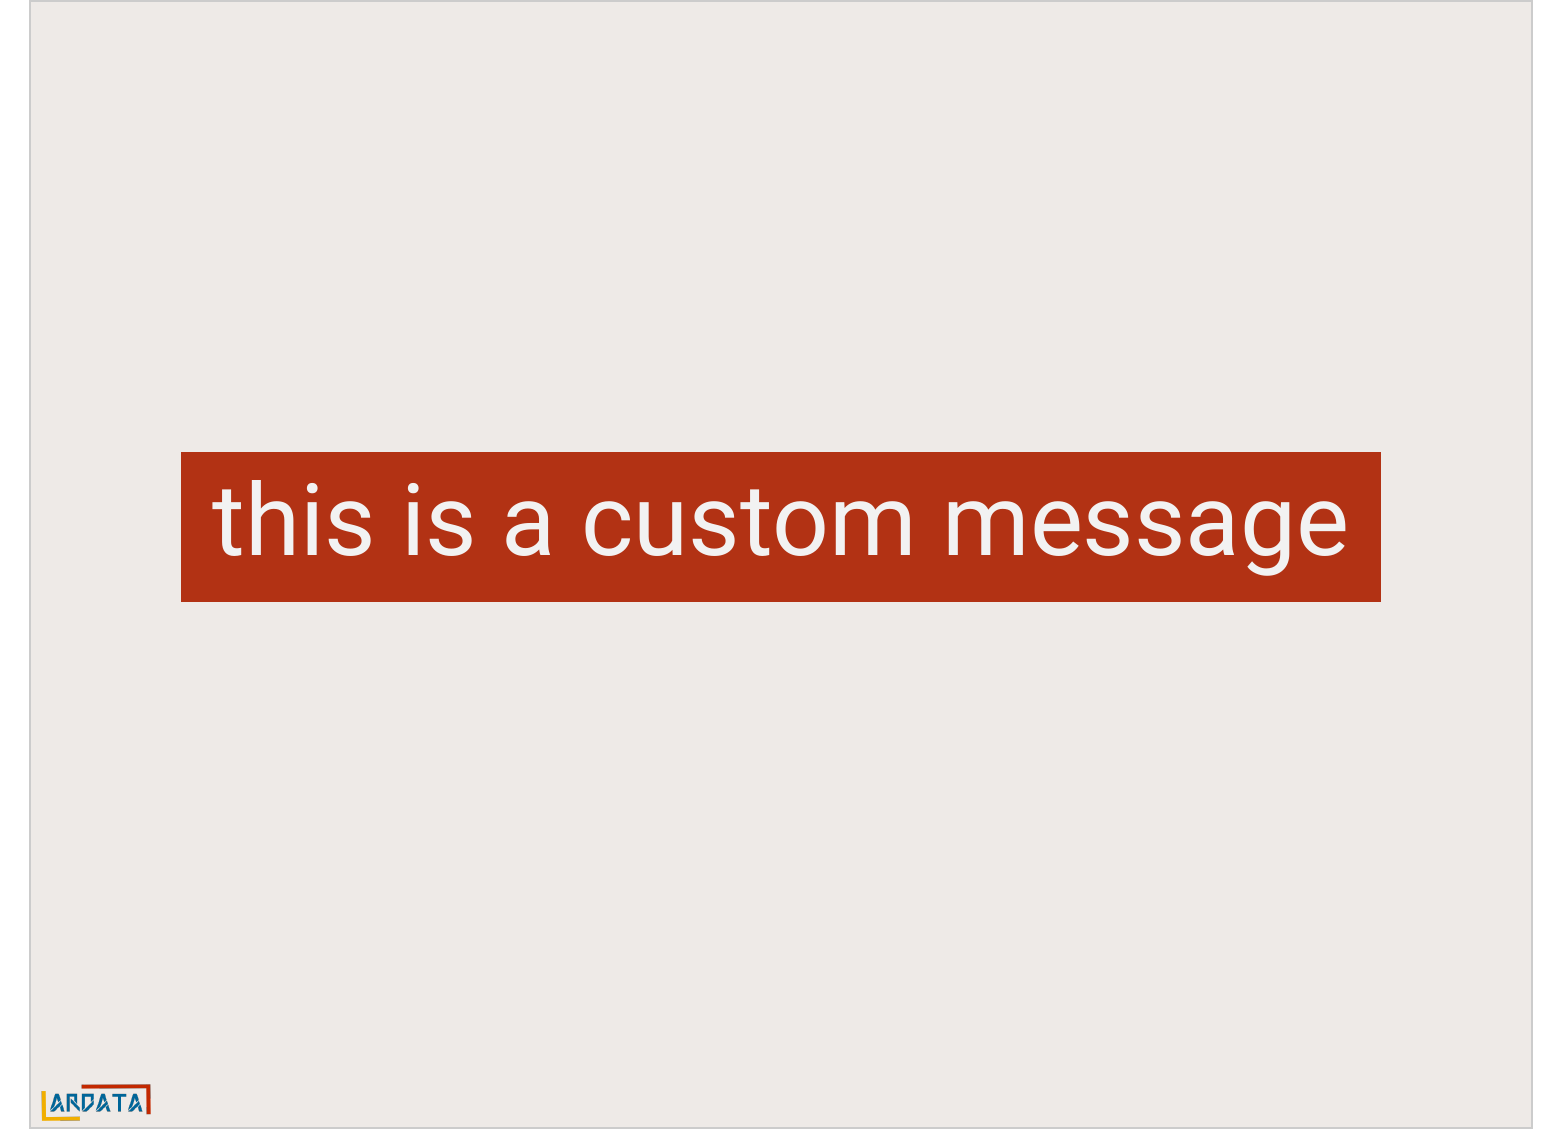
7.4.6 Center an element with fixed size
If you want to center on a slide an element with a fixed width, for example a flextable or an image, you need to know where to position the left position.
For that, you can use function officer::slide_size that gives the width and
the height of your slides (and the width of your fixed size element):
img.file <- file.path( R.home("doc"), "html", "logo.jpg" )
ppt <- read_pptx()
ppt <- add_slide(ppt, layout = "Title and Content", master = "Office Theme")

s_s <- slide_size(ppt)
s_w <- s_s$width # width of slides
s_h <- s_s$height # width of slides
left <- (s_w/2) - (2.78/2)
top <- (s_h/2) - (2.12/2)

ppt <- ph_with(ppt, value = external_img(img.file, width = 2.78, height = 2.12),
               location = ph_location(left = left, top = top),
               use_loc_size = FALSE)

print(ppt, target = "static/office/ph_with_location_5.pptx")
7.4.7 A four content layout
Some users need to produce slides with more complex layouts. The example below shows the PowerPoint document used as a template and then the code needed to fill in the four placeholders in our layout.
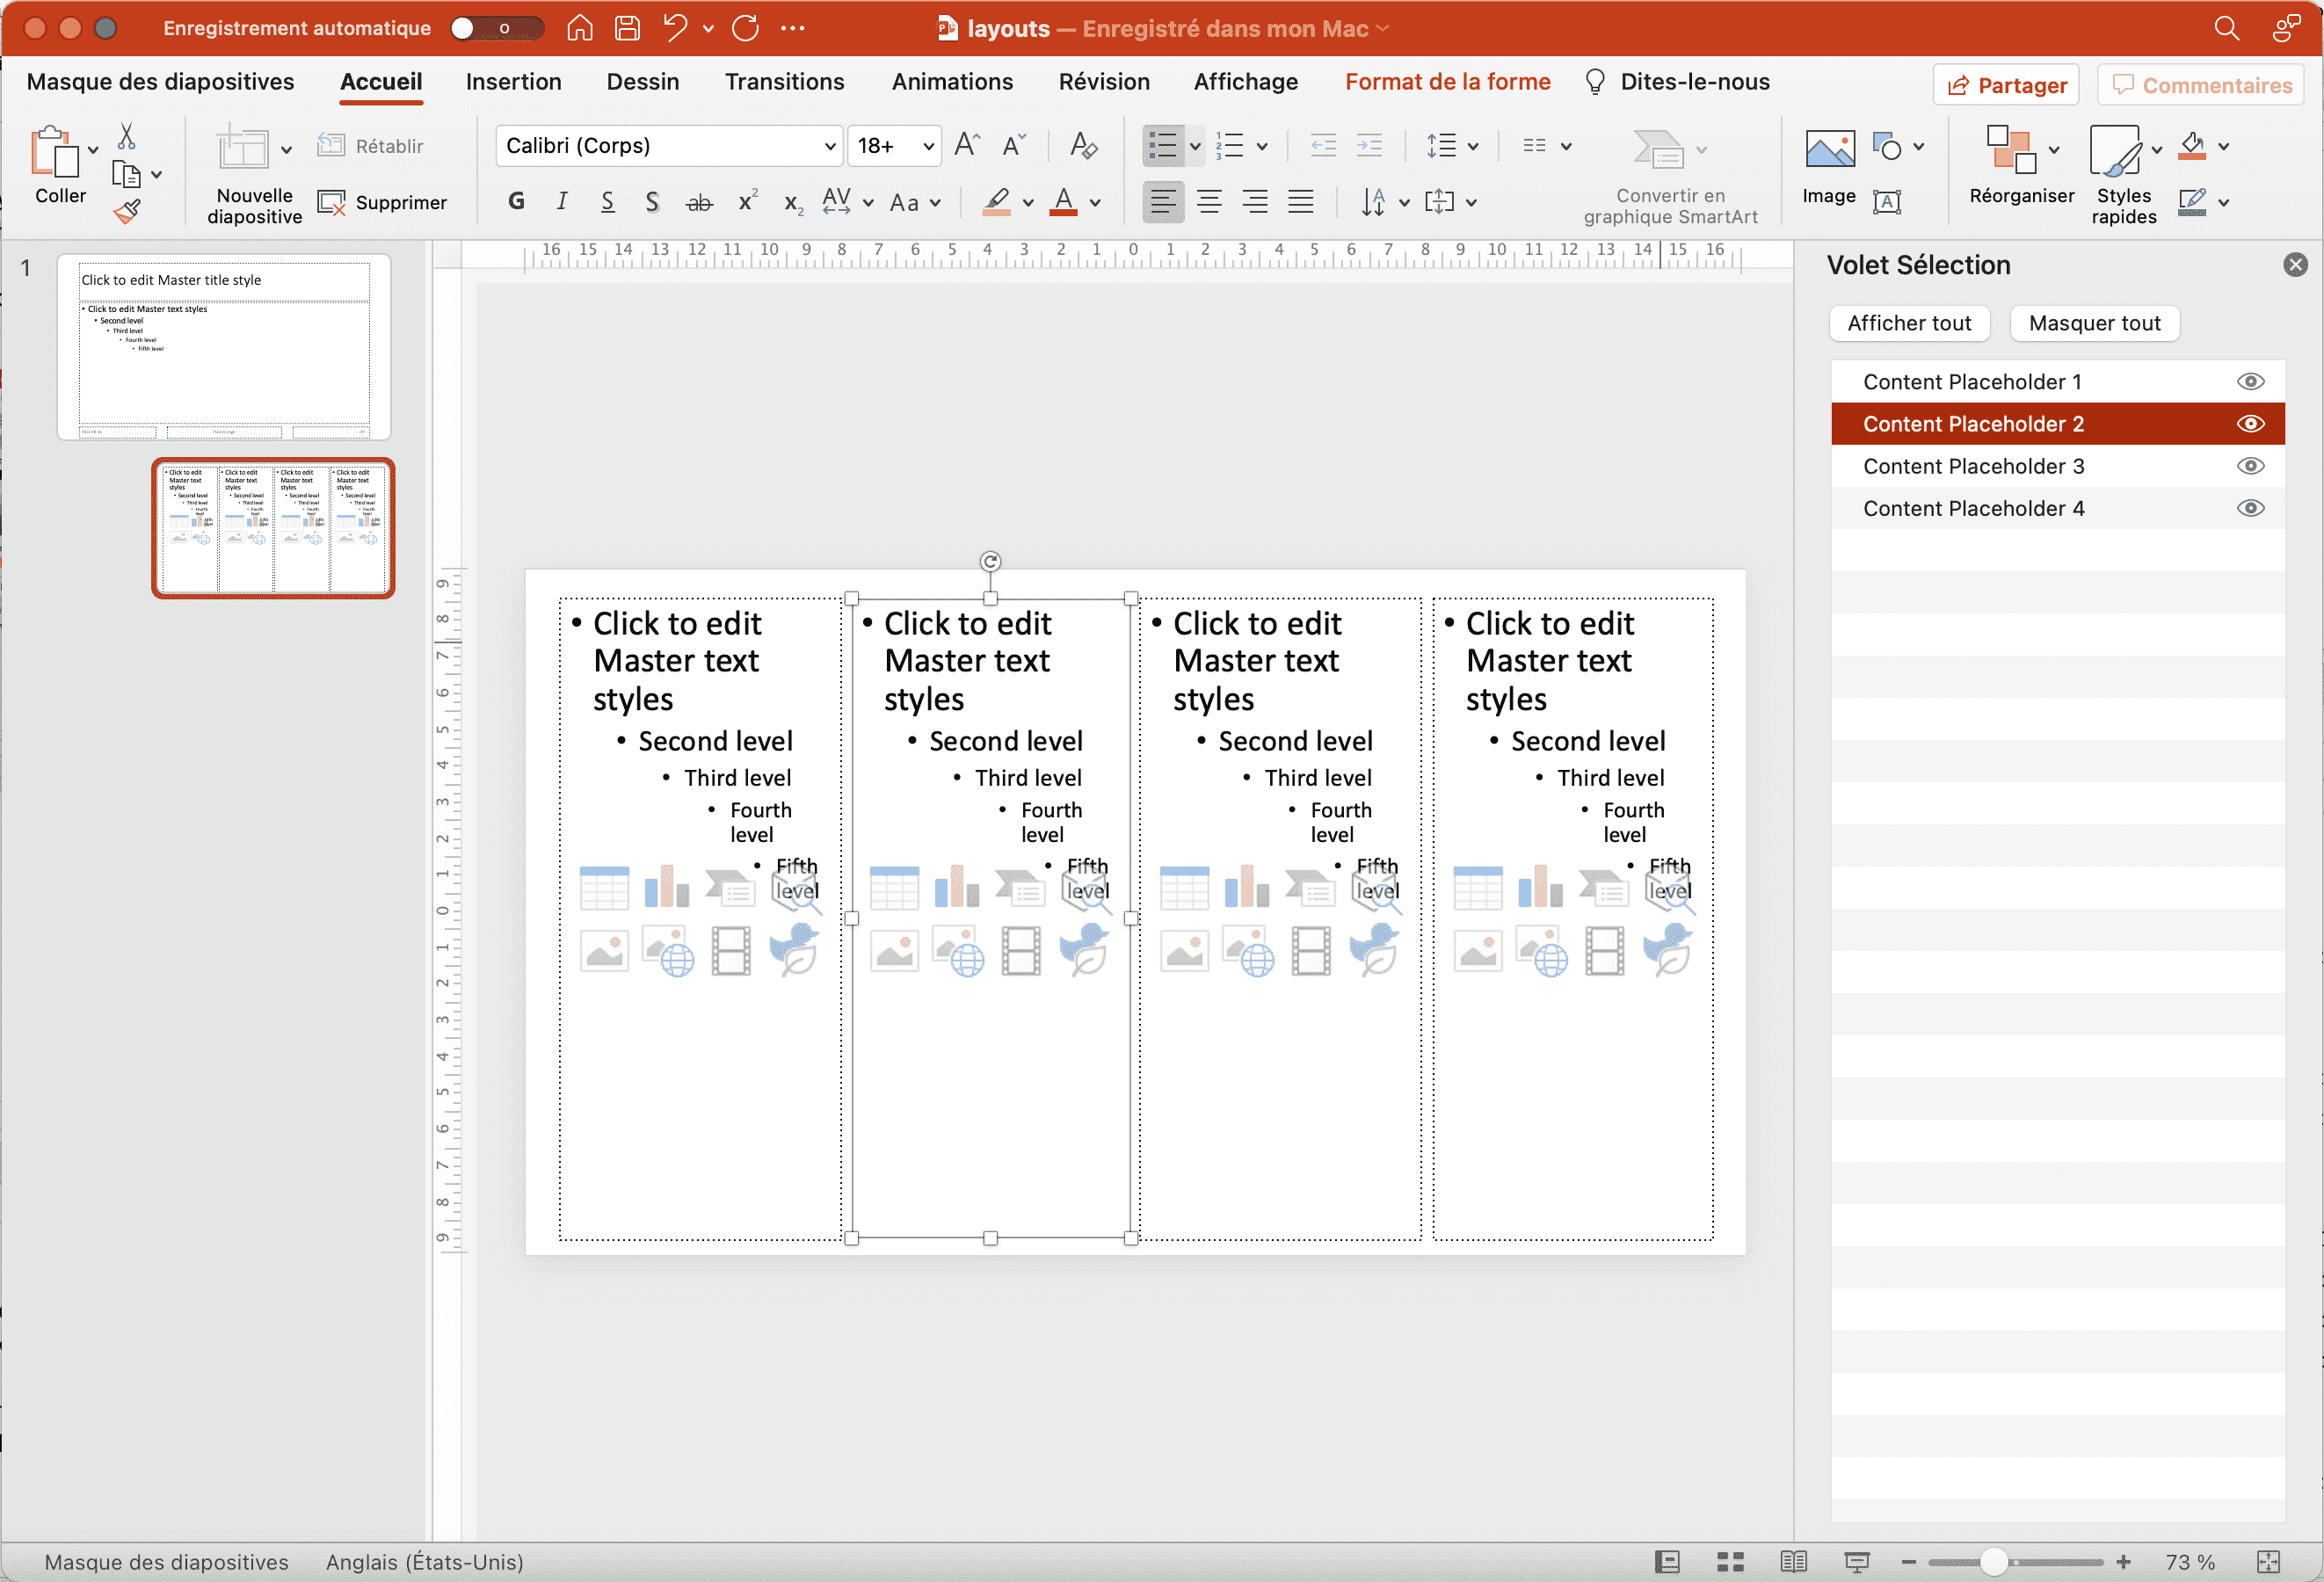
doc <- read_pptx("templates/four-content.pptx")
four_content_properties <-  layout_properties(doc, layout = "Four contents")
four_content_properties
master_name | name | type | type_idx | id | ph_label | ph | offx | offy | cx | cy | rotation | fld_id | fld_type |
|---|---|---|---|---|---|---|---|---|---|---|---|---|---|
character | character | character | numeric | integer | character | character | numeric | numeric | numeric | numeric | numeric | character | character |
Office Theme | Four contents | body | 1 | 3 | Content Placeholder 1 | <p:ph sz="half" idx="1"/> | 0.4 | 0.3 | 3.0 | 7.0 | |||
Office Theme | Four contents | body | 2 | 9 | Content Placeholder 3 | <p:ph sz="half" idx="14"/> | 6.7 | 0.3 | 3.0 | 7.0 | |||
Office Theme | Four contents | body | 3 | 4 | Content Placeholder 4 | <p:ph sz="half" idx="2"/> | 9.9 | 0.3 | 3.0 | 7.0 | |||
Office Theme | Four contents | body | 4 | 8 | Content Placeholder 2 | <p:ph sz="half" idx="13"/> | 3.6 | 0.3 | 3.0 | 7.0 | |||
n: 4 | |||||||||||||
The strategy used is to name the placeholder identifiers in the template layout and then use these identifiers to specify where to put the reporting elements. To do this, we use the function ph_location_label(ph_location_label(ph_label = 'id')).
chart_01 <- ms_barchart(data = browser_data, x = "browser", y = "value", group = "serie") |>
  chart_settings(dir = "vertical", grouping = "clustered", gap_width = 50) |>
  chart_ax_x(cross_between = "between", major_tick_mark = "out") |>
  chart_ax_y(cross_between = "midCat", major_tick_mark = "in")

add_slide(doc, layout = "Four contents") |>
  ph_with(value = chart_01, location = ph_location_label(ph_label = "Content Placeholder 1")) |>
  ph_with(value = chart_01, location = ph_location_label(ph_label = "Content Placeholder 2")) |>
  ph_with(value = chart_01, location = ph_location_label(ph_label = "Content Placeholder 3")) |>
  ph_with(value = chart_01, location = ph_location_label(ph_label = "Content Placeholder 4")) |>
  print(target = "static/office/four_content_demo.pptx")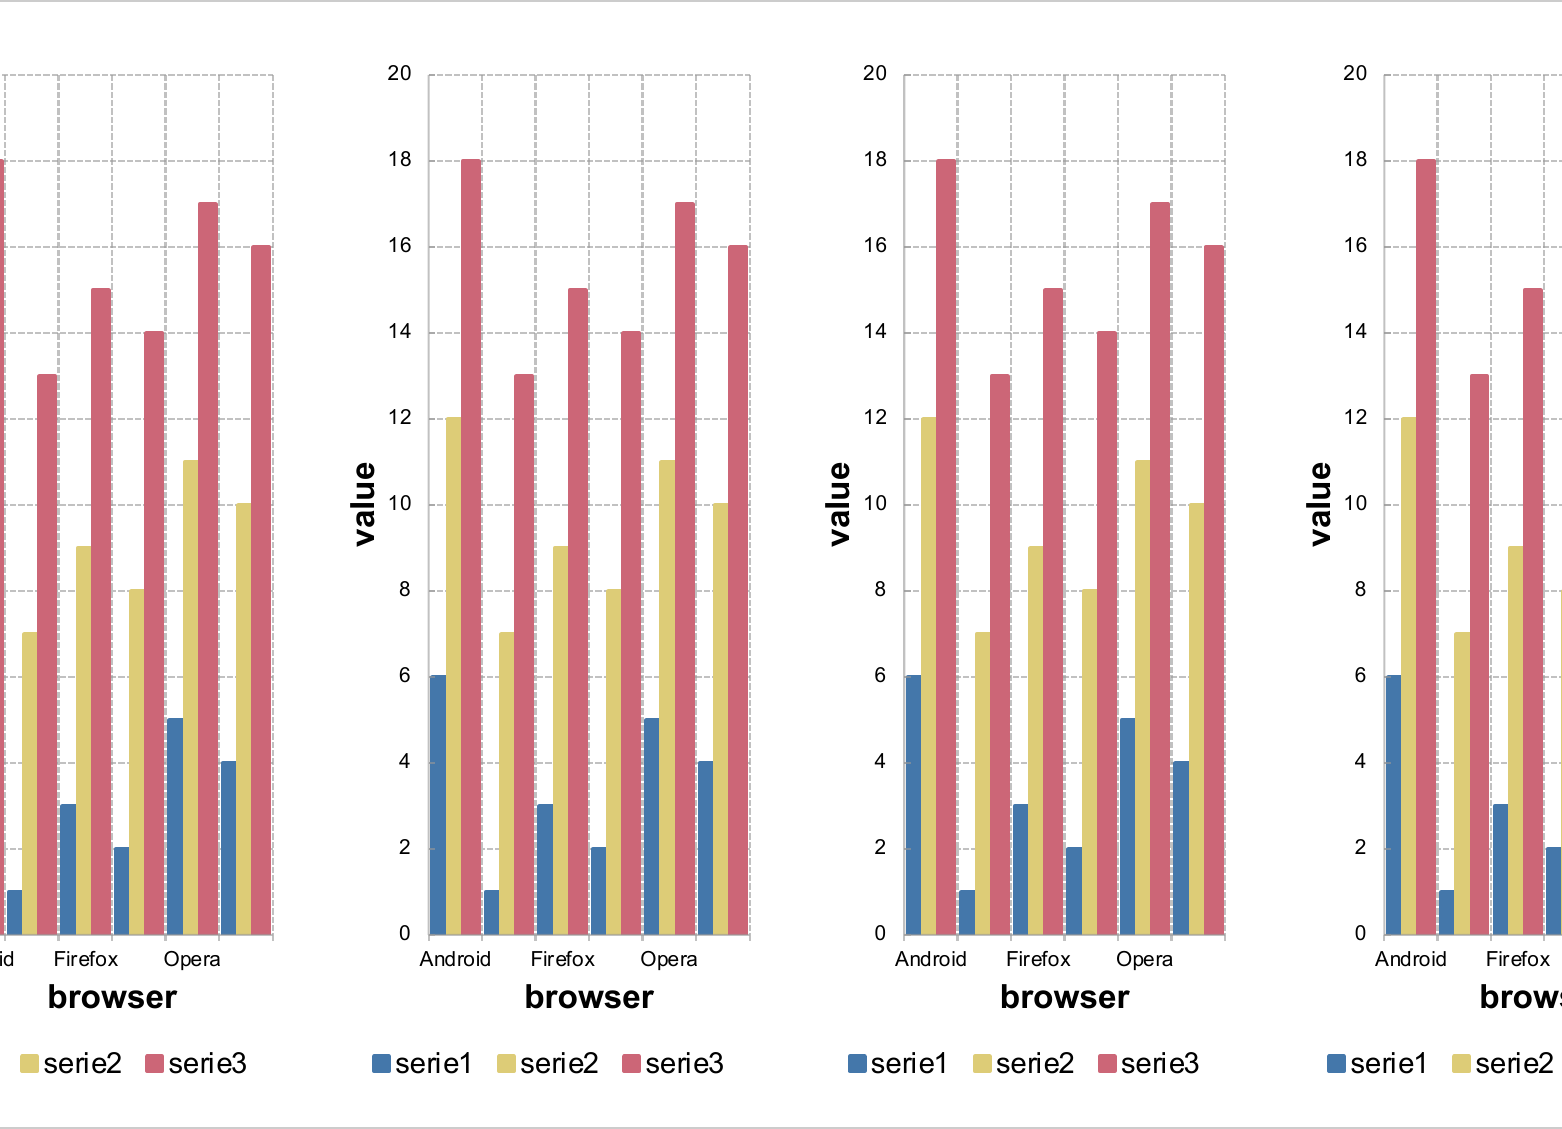
7.5 Supported contents
The following types of content are supported:
- vectors of text, numeric and factor
- formatted paragraphs made with fpar
- list of paragraphs with block_list
- unordered_list
- data.frame
- ggplot objects
- external_img
- flextable
- Microsoft charts with mschart and editable vector graphics with rvg
7.5.1 Text and vectors
doc <- read_pptx()
doc <- add_slide(doc, layout = "Two Content", master = "Office Theme")
doc <- ph_with(doc, value = pi, location = ph_location_type(type = "title") )
doc <- ph_with(doc, value = as.factor(letters[1:2]), location = ph_location_type(type = "ftr") )
doc <- ph_with(doc, value = c("one blah", "two blah"), location = ph_location_left() )
doc <- ph_with(doc, value = c("three blah", "four blah"), location = ph_location_right() )
print(doc, target = "static/office/ph_with_vectors.pptx")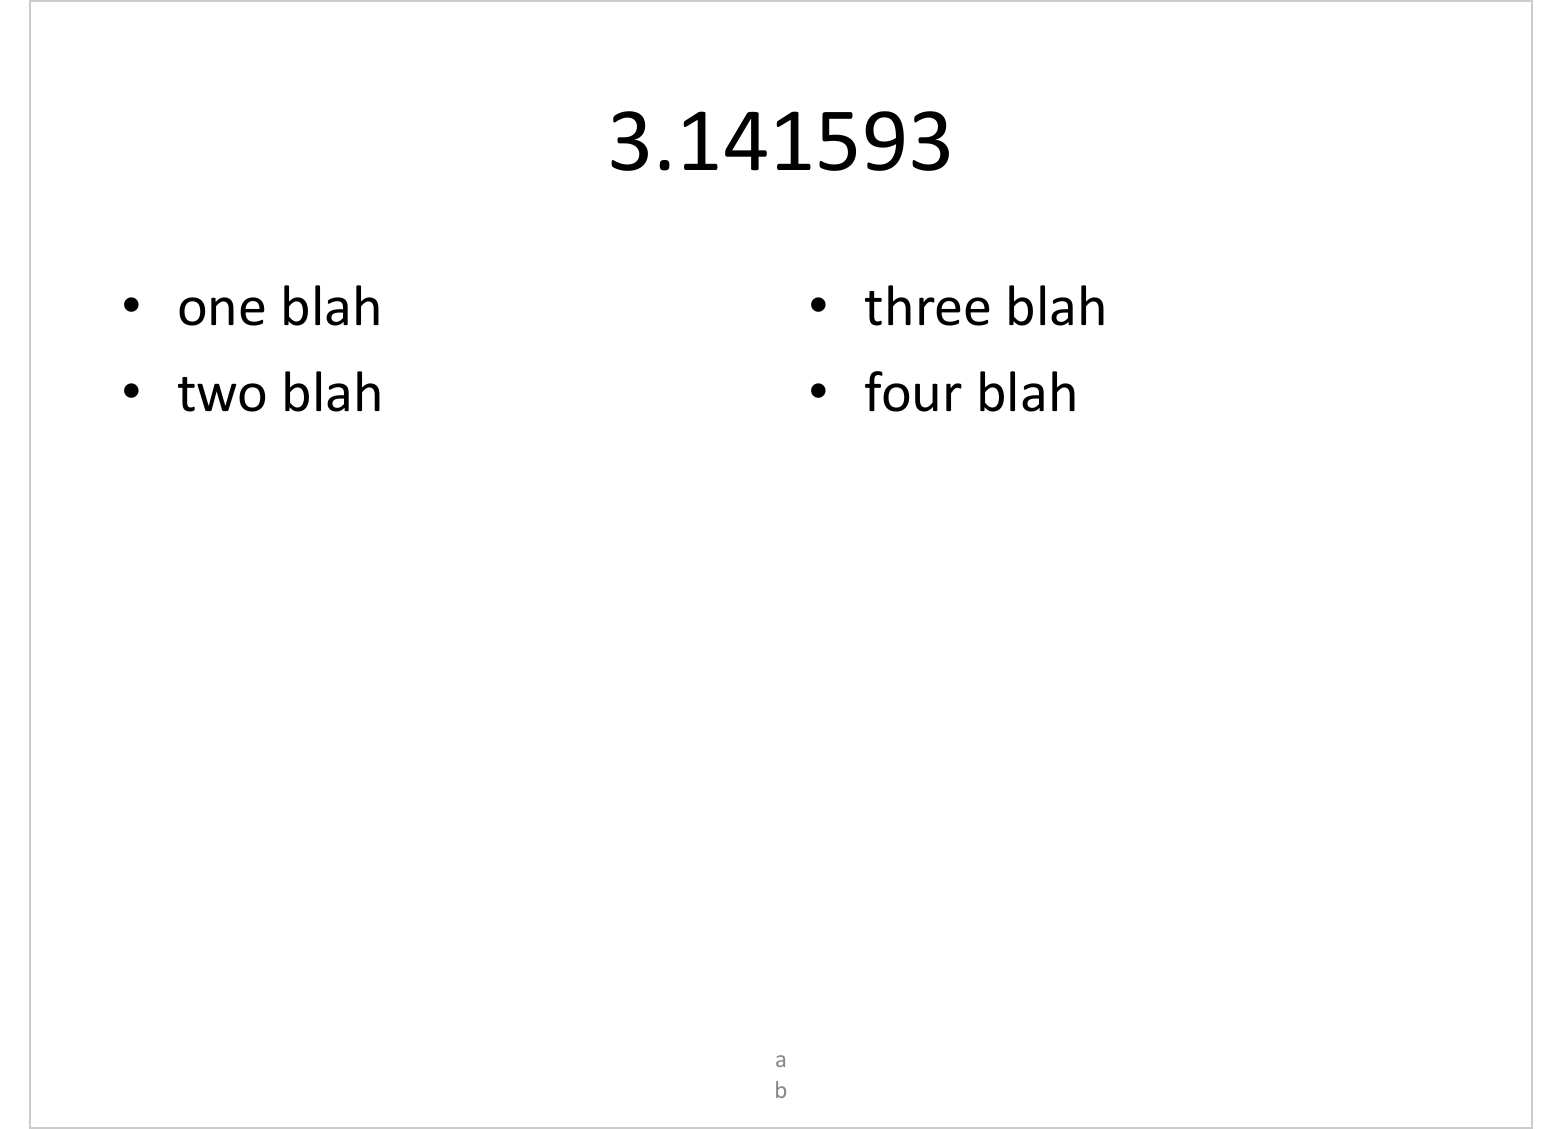
7.5.2 data.frame
doc <- read_pptx()
doc <- add_slide(doc, layout = "Title and Content")
doc <- ph_with(x = doc, value = head(iris),
   location = ph_location_type(type = "body") )
print(doc, target = "static/office/ph_with_df.pptx")
7.5.3 ggplot objects
library(ggplot2)
gg_plot <- ggplot(data = iris ) +
  geom_point(
    mapping = aes(Sepal.Length, Petal.Length, color = Species),
    size = 3) + theme_minimal()

doc <- read_pptx()
doc <- add_slide(doc, layout = "Title and Content")
doc <- ph_with(x = doc, value = gg_plot,
               location = ph_location_fullsize() )
doc <- ph_with(x = doc, "a ggplot example",
               location = ph_location_type(
                 type = "title") )
print(doc, target = "static/office/ph_with_gg.pptx")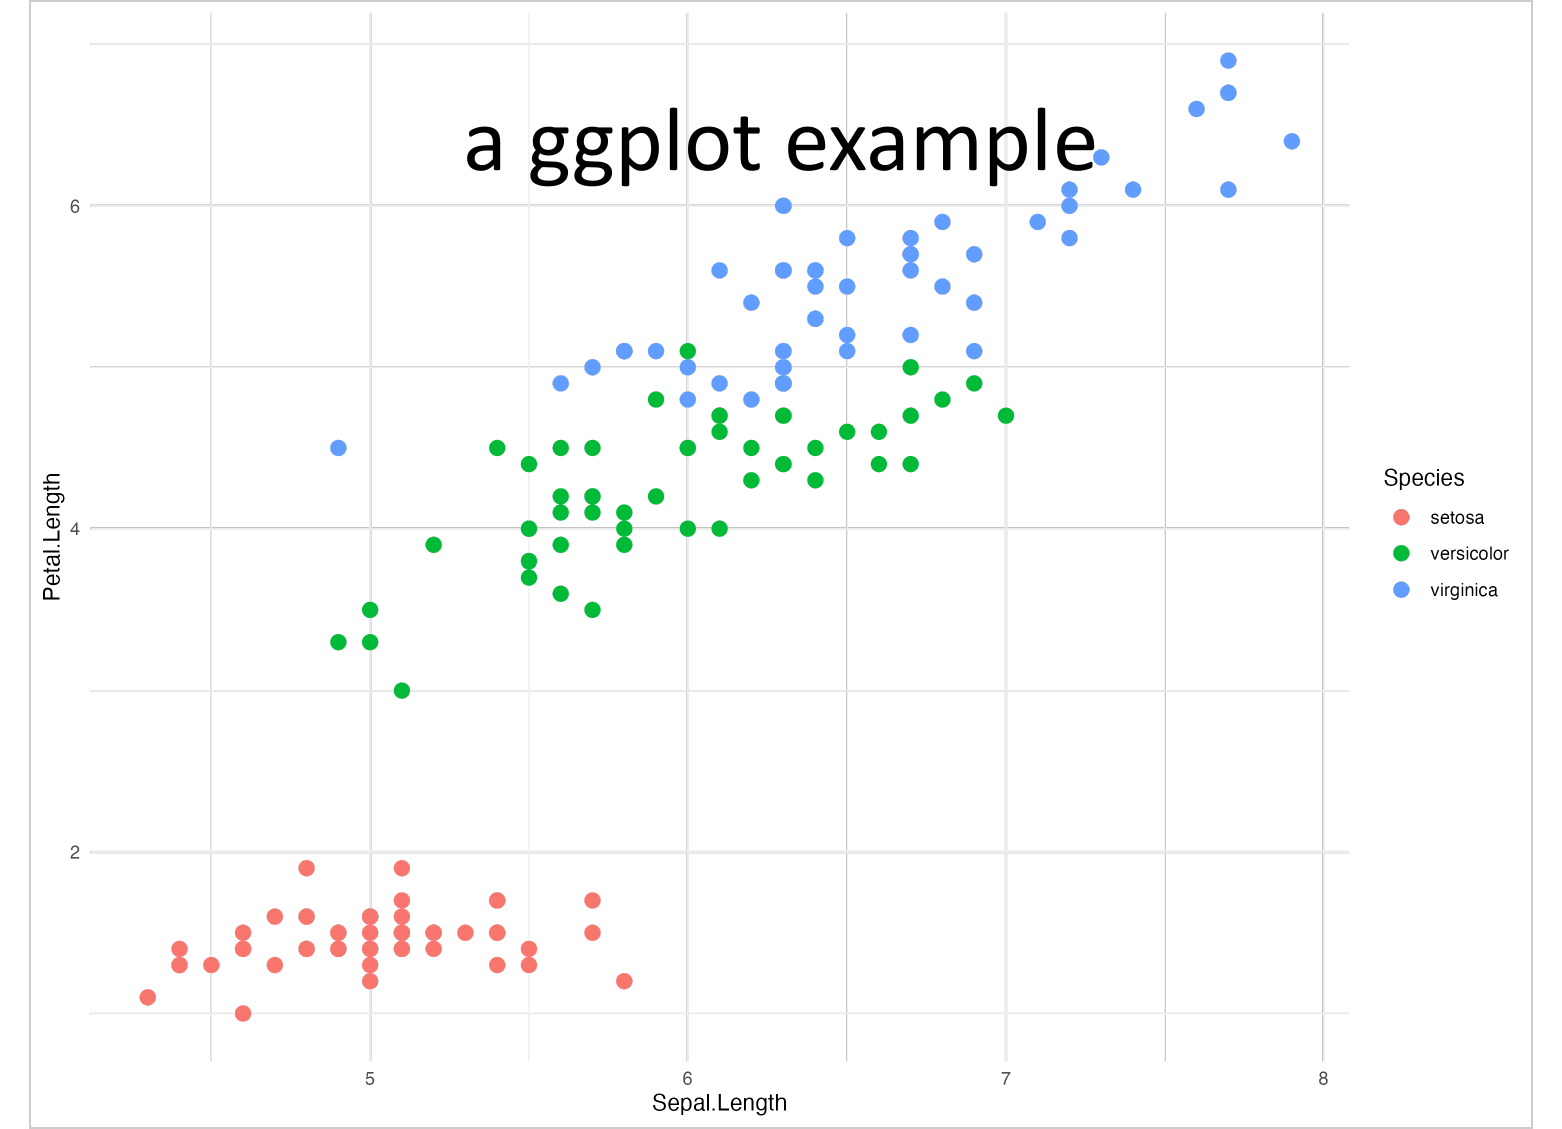
7.5.4 Images
While external_img() is considered a chunk that fits into a paragraph
for Word, it is used with PowerPoint as content on a slide.
It can also be sized with the dimensions of selected location by using use_loc_size = TRUE
in ph_with call.
img.file <- file.path( R.home("doc"), "html", "logo.jpg" )

doc <- read_pptx()
doc <- add_slide(doc, layout = "Title and Content")
doc <- ph_with(x = doc, external_img(img.file, width = 2.78, height = 2.12),
   location = ph_location_type(type = "body"), use_loc_size = FALSE )
doc <- add_slide(doc, layout = "Title and Content")
doc <- ph_with(x = doc, external_img(img.file),
   location = ph_location_type(type = "body"), use_loc_size = TRUE )
print(doc, target = "static/office/ph_with_img.pptx")
7.5.5 flextable
The width and height of the flextable can not be set with a ph_location
function because a flextable is a fixed size element.
The width and height of flextable are managed by flextable not by officer.
Control of flextable sizes is documentated here.
library(flextable)
ft <- flextable(head(mtcars))
ft <- autofit(ft)
doc <- read_pptx()
doc <- add_slide(doc, layout = "Title and Content")
doc <- ph_with(x = doc, ft,
   location = ph_location_type(type = "body") )
print(doc, target = "static/office/flextable.pptx")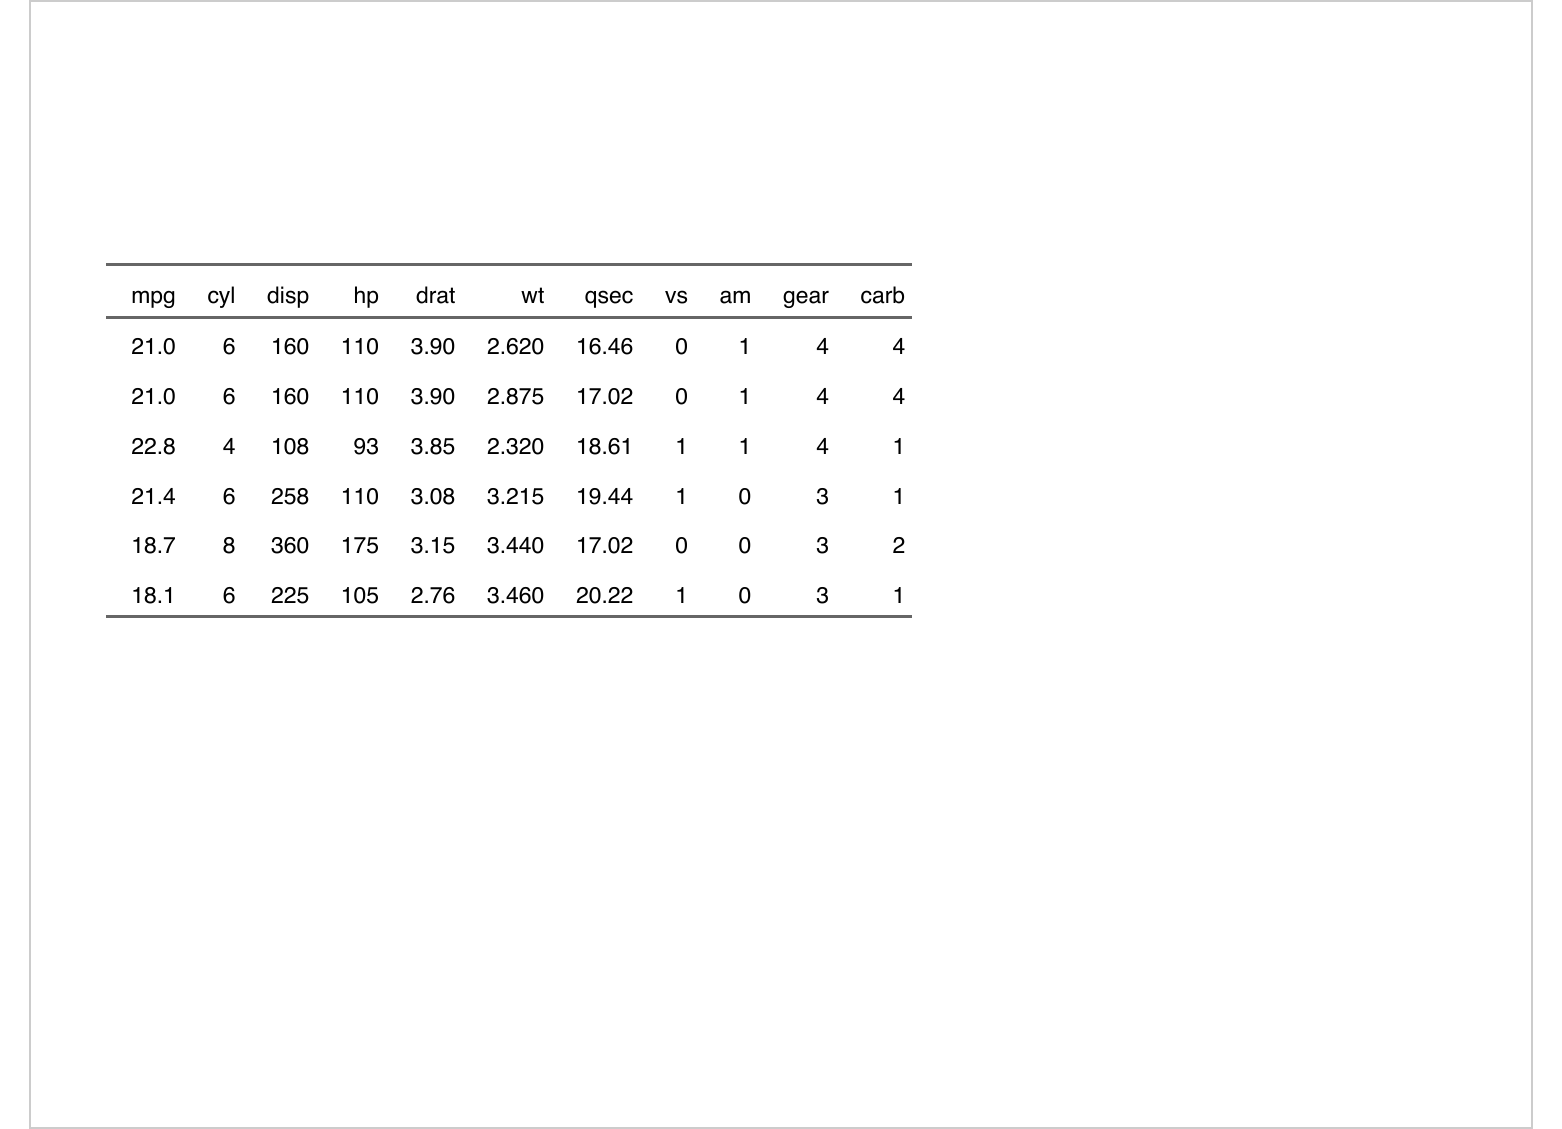
7.5.6 Editable graphics (rvg)
Package ‘rvg’ is providing a graphic device that produces Vector Graphics outputs in DrawingML format for Microsoft PowerPoint. This format let users edit the graphic elements (editable graphics) within PowerPoint and provide a very good rendering.
These raw XML outputs cannot be used as is. Functions dml() and ph_with()
have to be used to add vector graphics in the PowerPoint document. dml()
function is a simple wrapper to mark the plot instructions as Vector Graphics
instruction.
library(rvg)
editable_graph <- dml(ggobj = gg_plot)
doc <- read_pptx()
doc <- add_slide(doc, layout = "Title and Content")
doc <- ph_with(x = doc, editable_graph,
   location = ph_location_type(type = "body") )
print(doc, target = "static/office/rvg.pptx")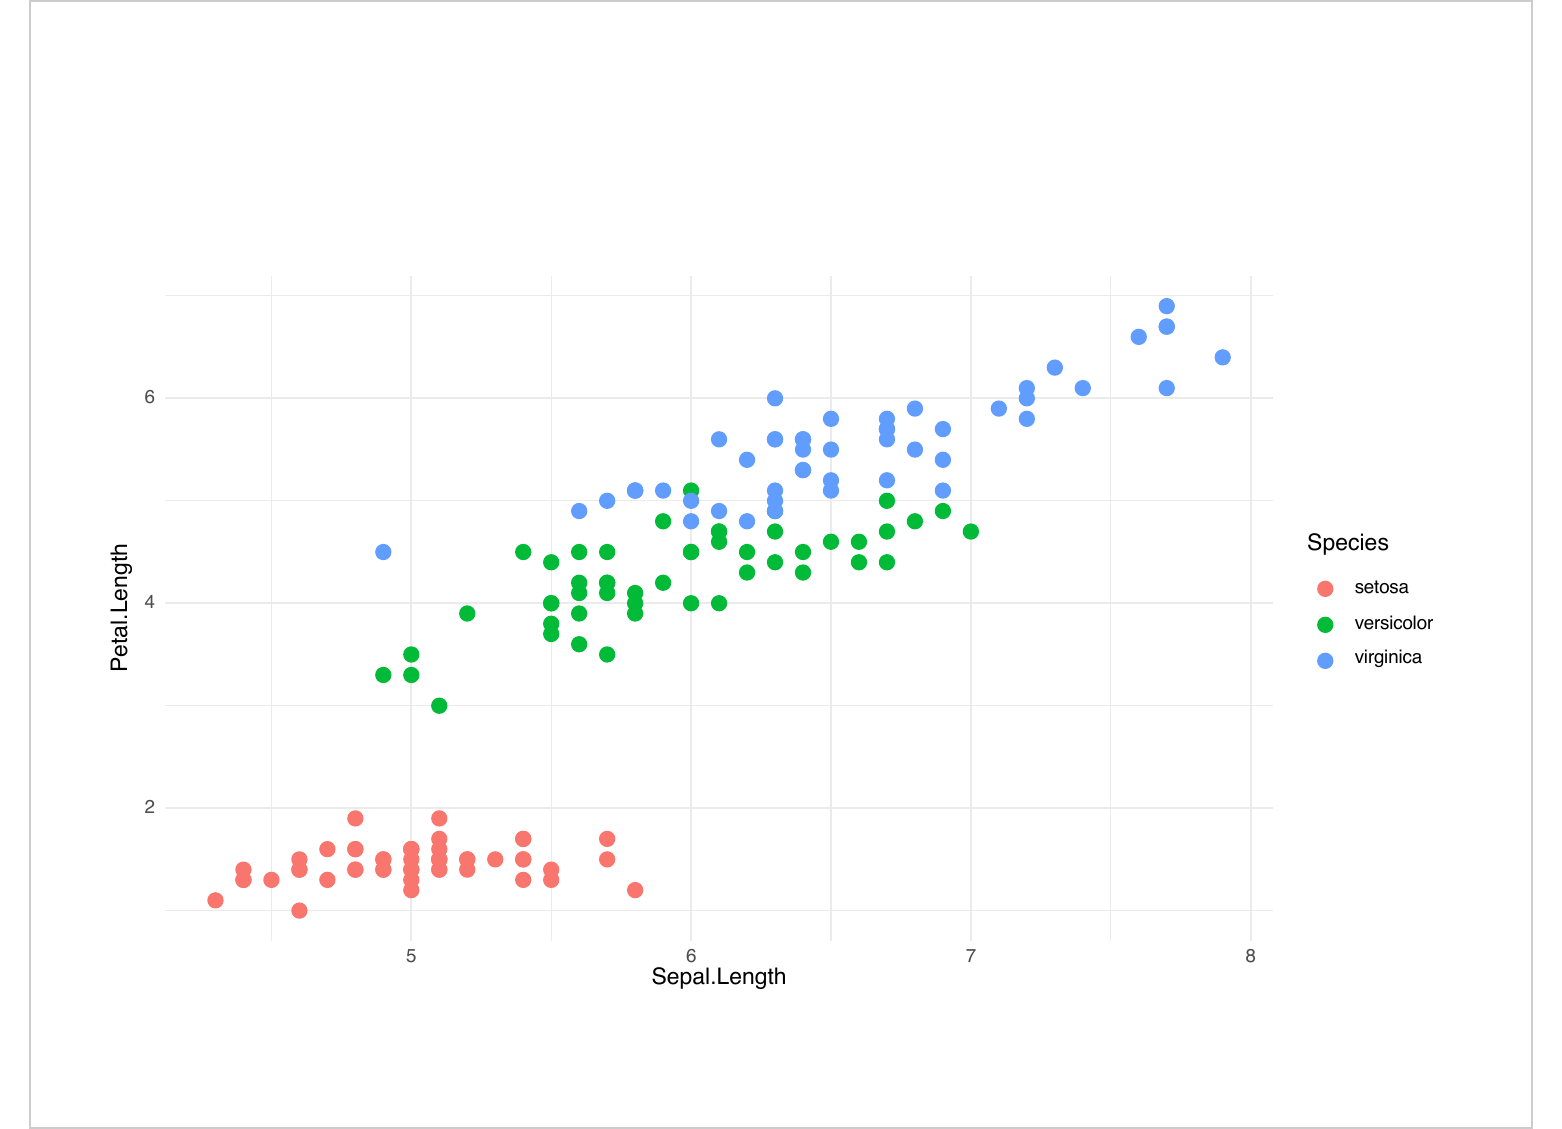
By default, theses graphics are editable, element edition can be disabled
with option dml(..., editable = FALSE).
Warning, these charts are not Microsoft office charts. They do not embed the data.
The same dml() wrapper can be embedded in an Excel workbook via
officer::sheet_add_drawing() — see the Editable vector graphics (dml)
subsection of the Excel chapter.
7.5.7 Microsoft charts
The ‘mschart’ package allows you to create native office graphics
that can be used with ‘officer’. Function ph_with() have to be
used as for other outputs.
library(mschart)

my_barchart <- ms_barchart(data = browser_data,
  x = "browser", y = "value", group = "serie")
my_barchart <- chart_settings( x = my_barchart,
  dir="vertical", grouping="clustered", gap_width = 50 )

read_pptx() |>
  add_slide(layout = "Title and Content", master = "Office Theme") |>
  ph_with(my_barchart, location = ph_location_type(type = "body")) |>
  print(target = "static/office/example_ppt_chart.pptx")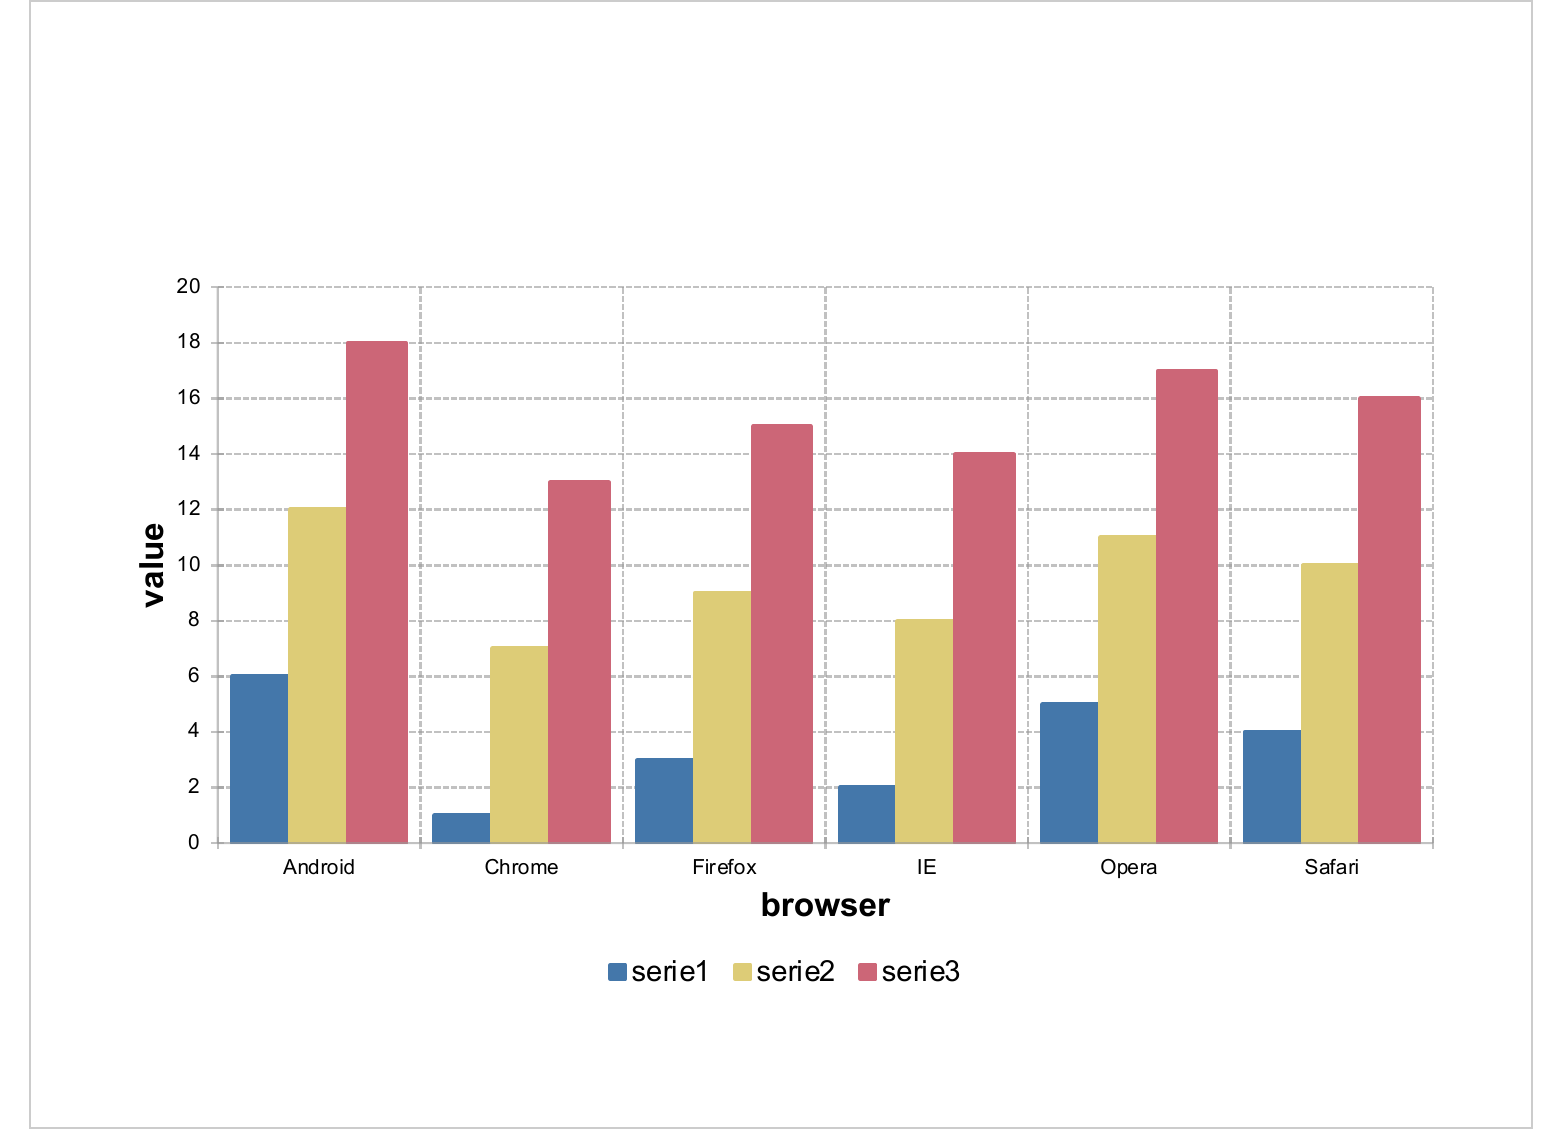
7.5.8 Multiple paragraphs
Multiple paragraphs are produced with function block_list() which
is an arrangement of paragraphs of text (made with fpar()).
The ph_with method also accepts a level_list option that allows the
list of paragraphs to be formatted as an unordered (bulleted) list.
# first define a block_list made of fpar ----
fp_t1 <- fp_text(bold = TRUE, font.size = 25)
fp_t2 <- fp_text(bold = TRUE, font.size = 25, color = "red")
fp_t3 <- fp_text(font.size = 25, color = "#006699")
par1 <- fpar(ftext("hello", fp_t2), ftext(" World", fp_t3), fp_p = fp_par(text.align = "left"))
par2 <- fpar(ftext("Salut", fp_t1), ftext(" Breton", fp_t3), fp_p = fp_par(text.align = "center"))

bl <- block_list(
  par1, par1, par1,
  par2, par2)

doc <- read_pptx()
doc <- add_slide(doc, layout = "Title and Content")
doc <- ph_with(x = doc, value = bl,
  level_list = seq_along(bl),
  location = ph_location_type(type = "body") )
doc <- ph_with(x = doc, value = bl,
               location = ph_location(label = "my_name",
                 left = 5, top = 3, width = 4, height = 4,
                 bg = "wheat", rotation = 90)
       )

print(doc, target = "static/office/ph_with_block_list.pptx")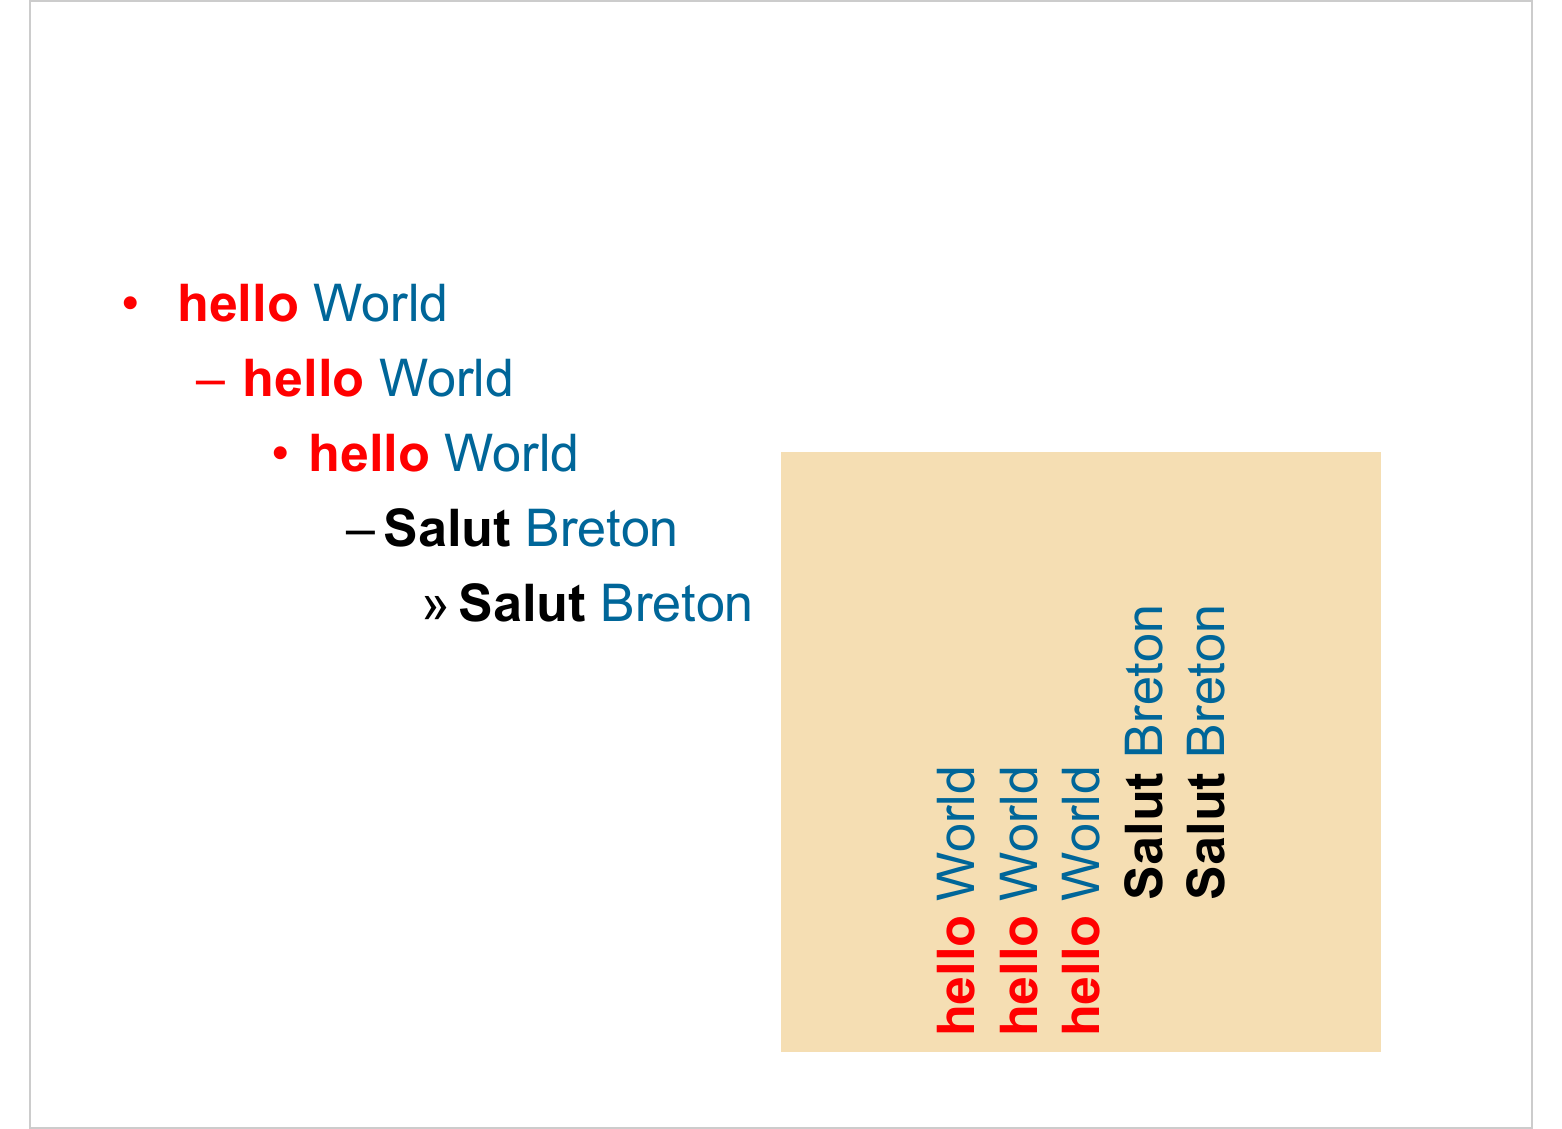
7.5.9 Single paragraph
see wrapper function named
fpar()(ablock_listis made offparobjects)
# first define a fpar ----
fp <- fpar(
    ftext("hello", fp_text(bold = TRUE, font.size = 40)),
    ftext(" world", prop = fp_text(color = "red", font.size = 40) )
  )

doc <- read_pptx()
doc <- add_slide(doc, layout = "Title and Content")
doc <- ph_with(x = doc, value = fp,
               location = ph_location_type(type = "title")
       )

print(doc, target = "static/office/ph_with_fpar.pptx")
7.5.10 Lists
Bulleted and numbered lists are built with list_item() and
block_list_items() — the same API used in Word (see the Word chapter).
Each item carries an integer level controlling nesting; list_type is
either "bullet" or "decimal". The resulting block_list_items object is
inserted into a placeholder with ph_with().
items <- block_list_items(
  list_item("Level 1 item",                               level = 1),
  list_item("Level 2 item",                               level = 2),
  list_item(fpar(
    ftext("Level 3", fp_text_lite(bold = TRUE, color = "red")),
    " with inline formatting"
  ),                                                      level = 3),
  list_item("Back to level 1",                            level = 1),
  list_type = "bullet"
)

read_pptx() |>
  add_slide(layout = "Title and Content") |>
  ph_with(value = items, location = ph_location_type(type = "body")) |>
  print(target = "static/office/ph_with_list.pptx")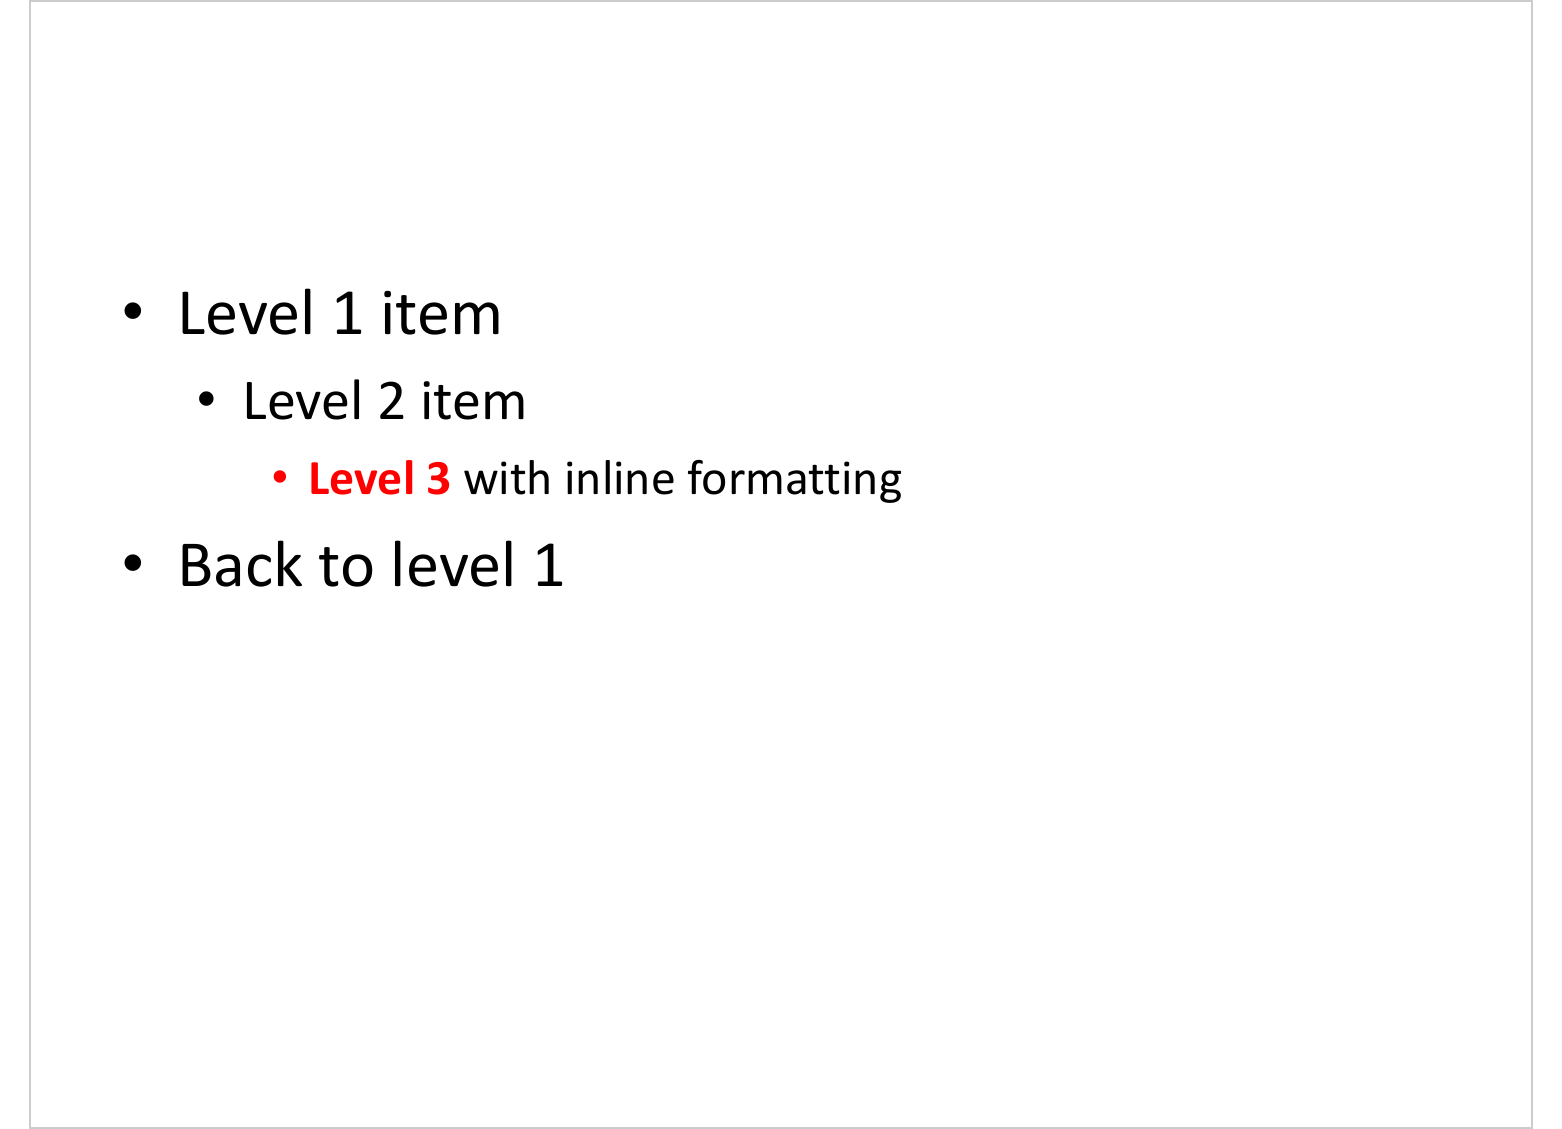
The older unordered_list() function is still available for backward
compatibility, but block_list_items() is the recommended entry point — it
supports numbered lists, rich text via fpar(), and shares a single API
across Word and PowerPoint.
7.6 Slide selection and manipulation
add_slide() is not the only function to let you manipulate slides,
remove_slide()allows you to delete a slide,move_slide()is used to move a slide in the slideshow,on_slide()allows you to position yourself on a slide in the slideshow.
The following code is creating a slideshow made of three slides.
loc <- ph_location_type(type = "title")
my_pres <- read_pptx()
for(i in 1:3){
  my_pres <- add_slide(my_pres, layout = "Title and Content")
  my_pres <- ph_with(my_pres, value = paste("Slide", i), location = loc)
}
A slide can be moved with the move_slide() function.
my_pres <- move_slide(my_pres, index = 1, to = 3)
print(my_pres, target = "static/office/slide_manip_1.pptx")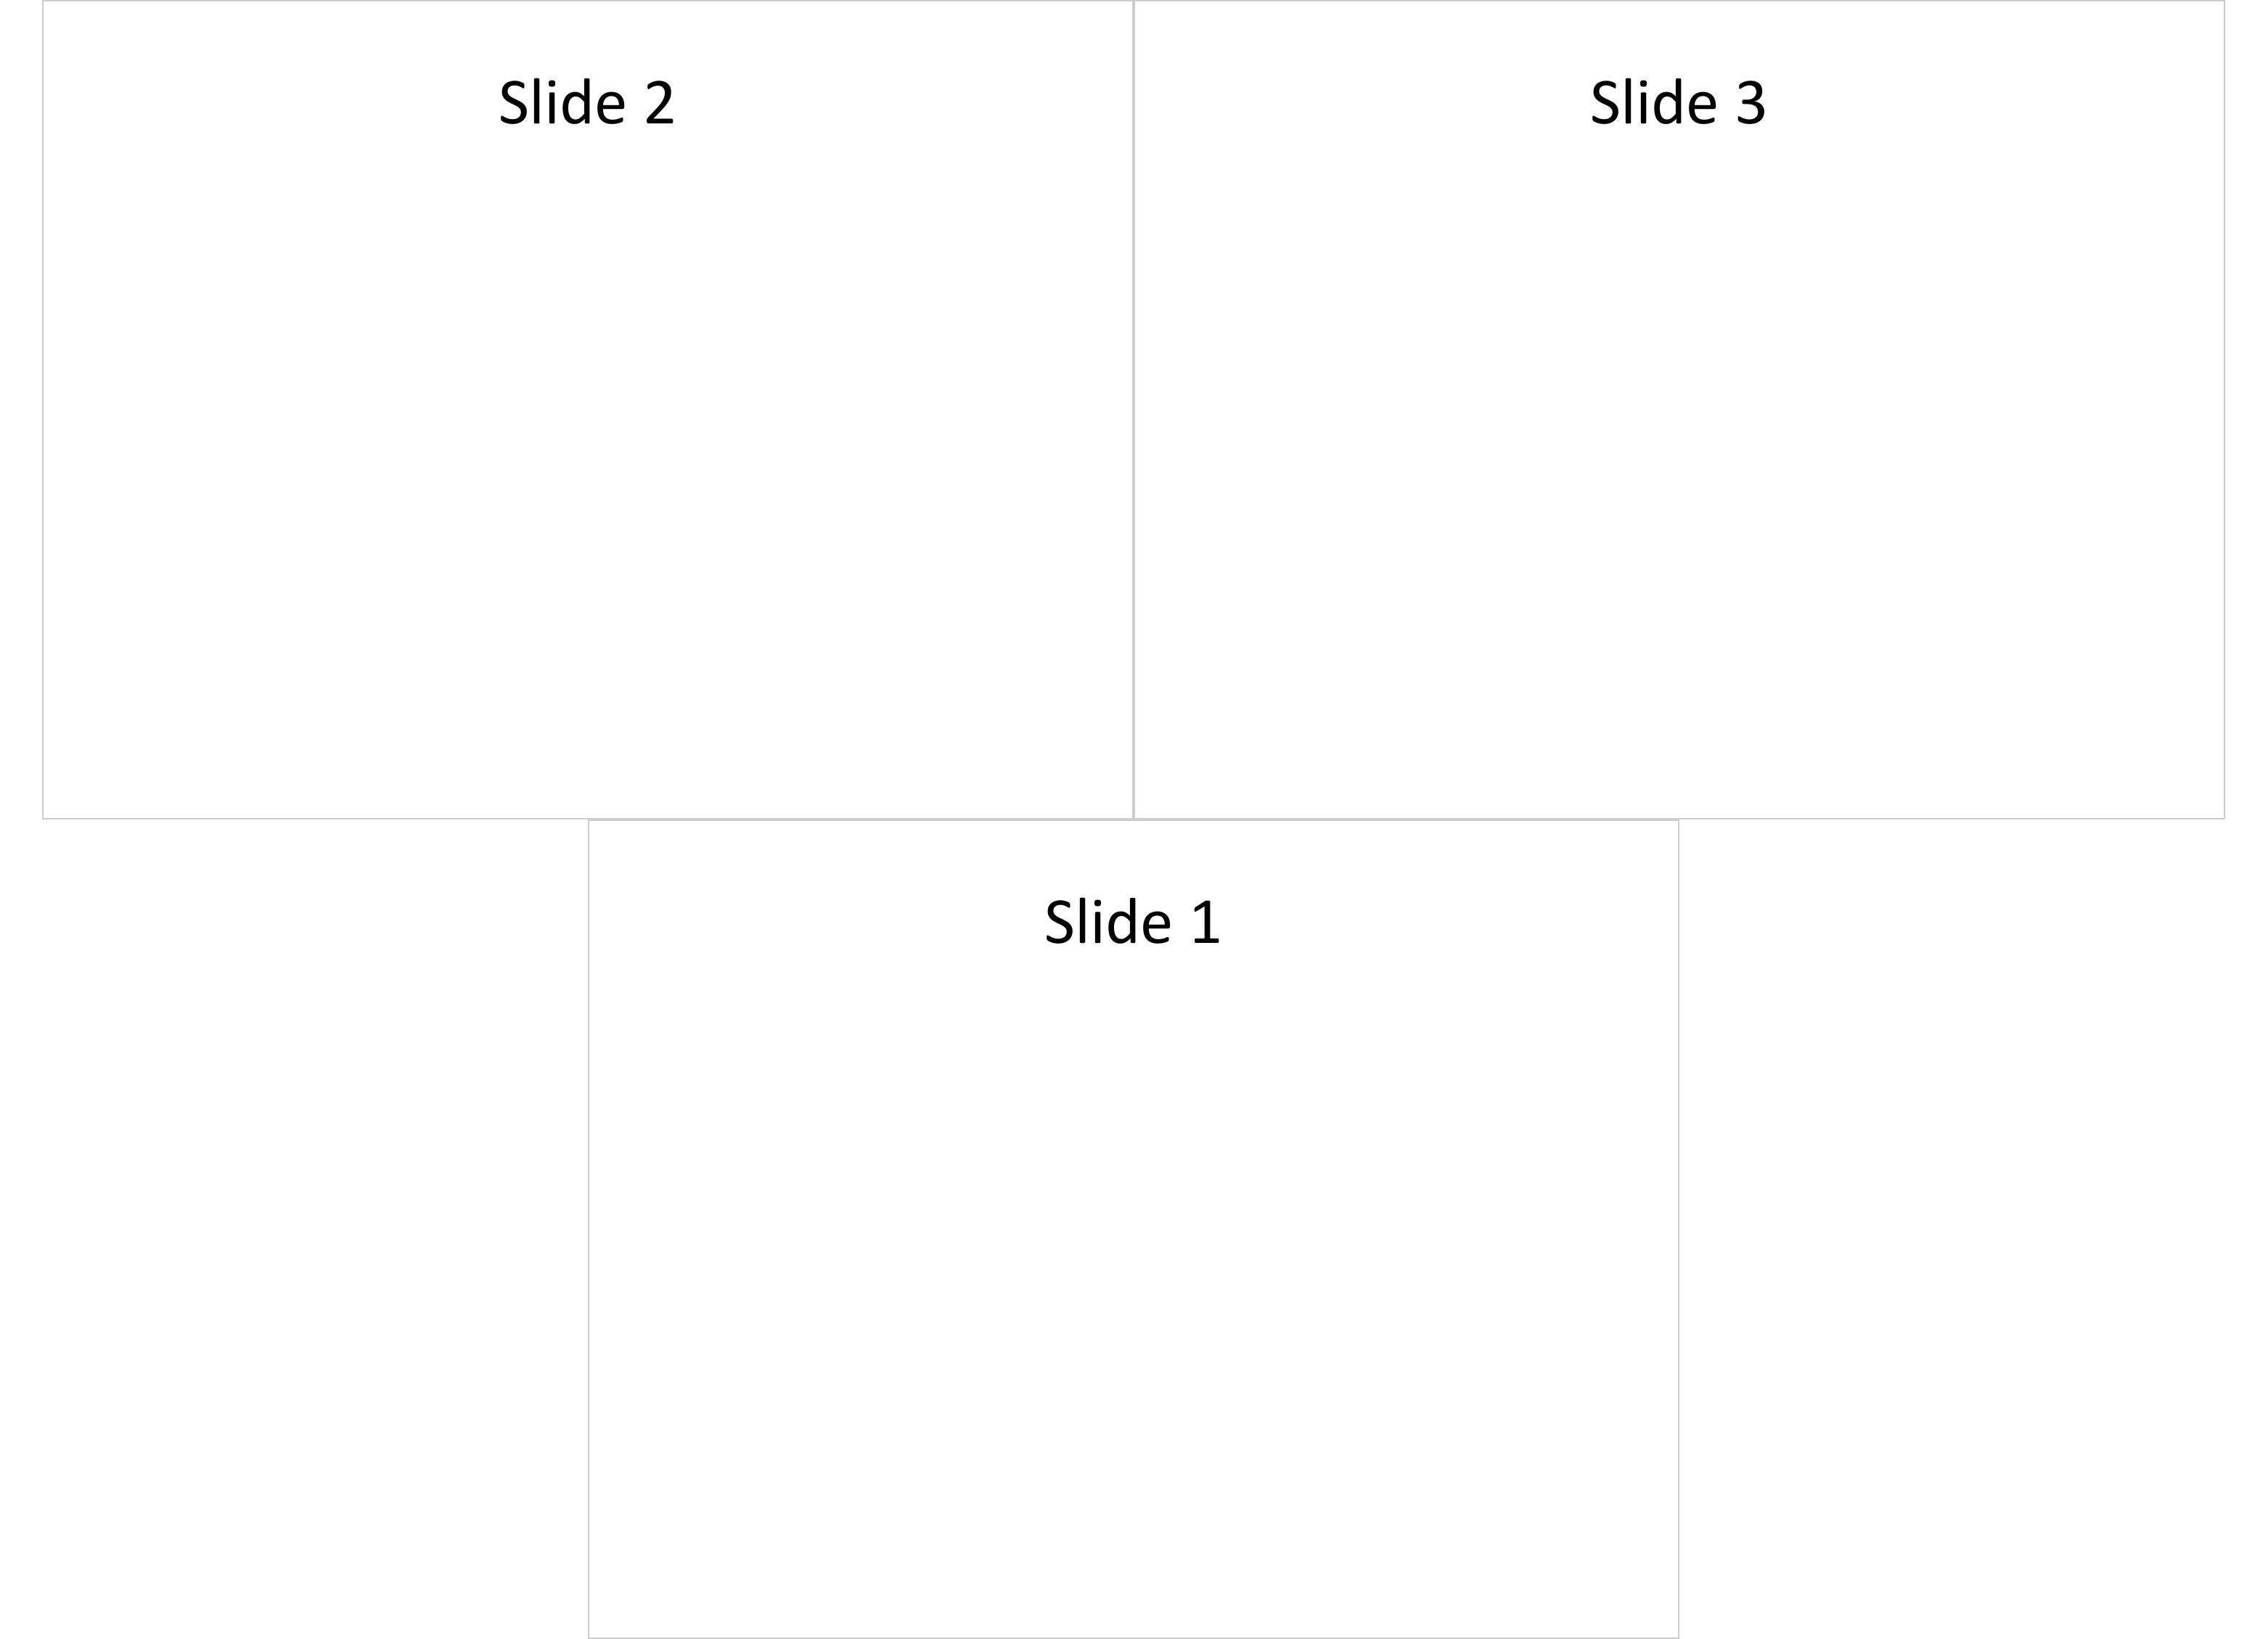
A slide can be removed with the remove_slide() function.
my_pres <- remove_slide(my_pres, index = 1)
print(my_pres, target = "static/office/slide_manip_2.pptx")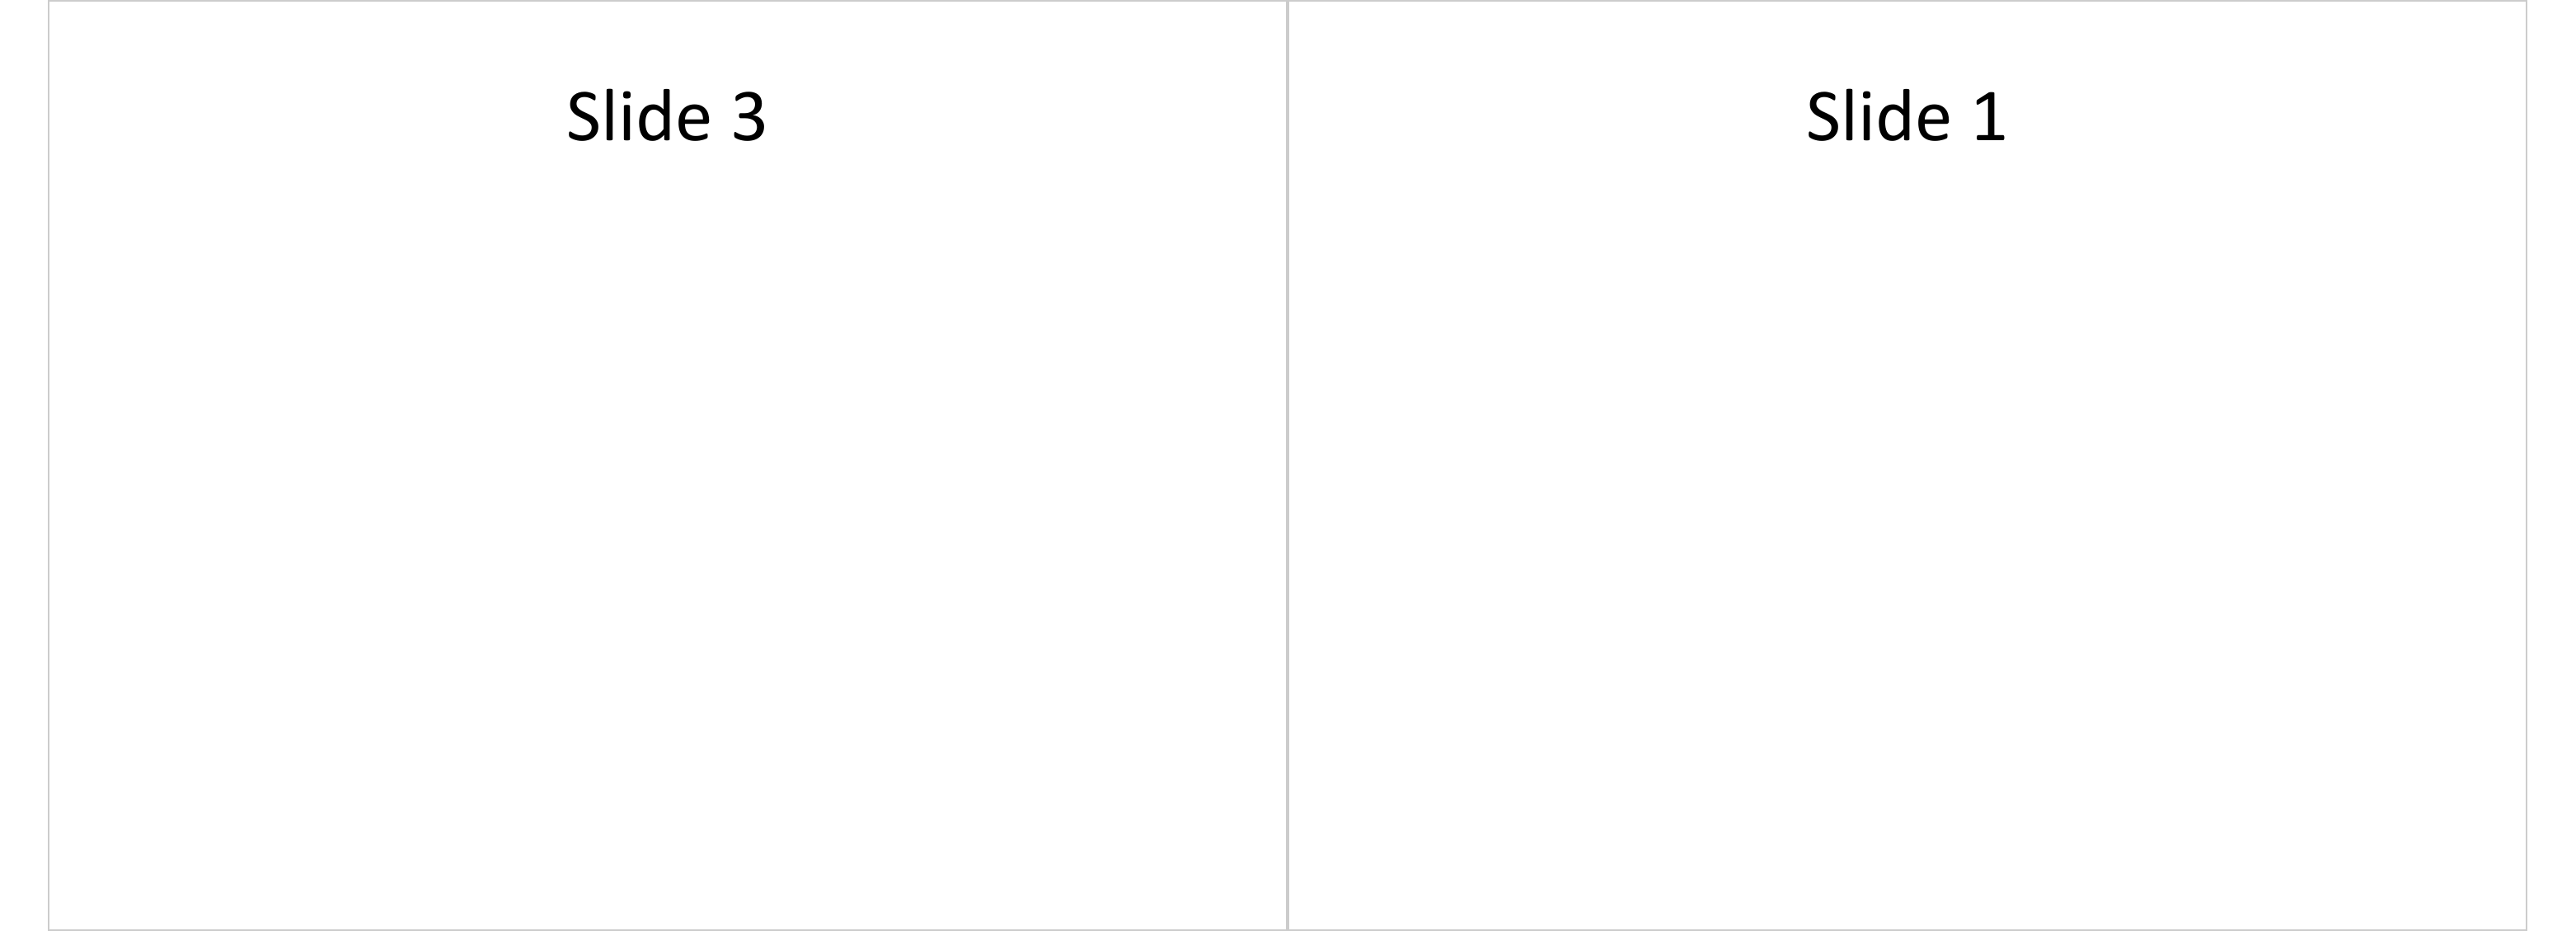
A slide can be selected with the on_slide() function. You can
then manipulate the slide, i.e. add or replace content.
my_pres <- on_slide(my_pres, index = 1)
my_pres <- ph_remove(my_pres, type = "title")
my_pres <- ph_with(my_pres, value = paste("Slide", i, "updated"), location = loc)
print(my_pres, target = "static/office/slide_manip_3.pptx")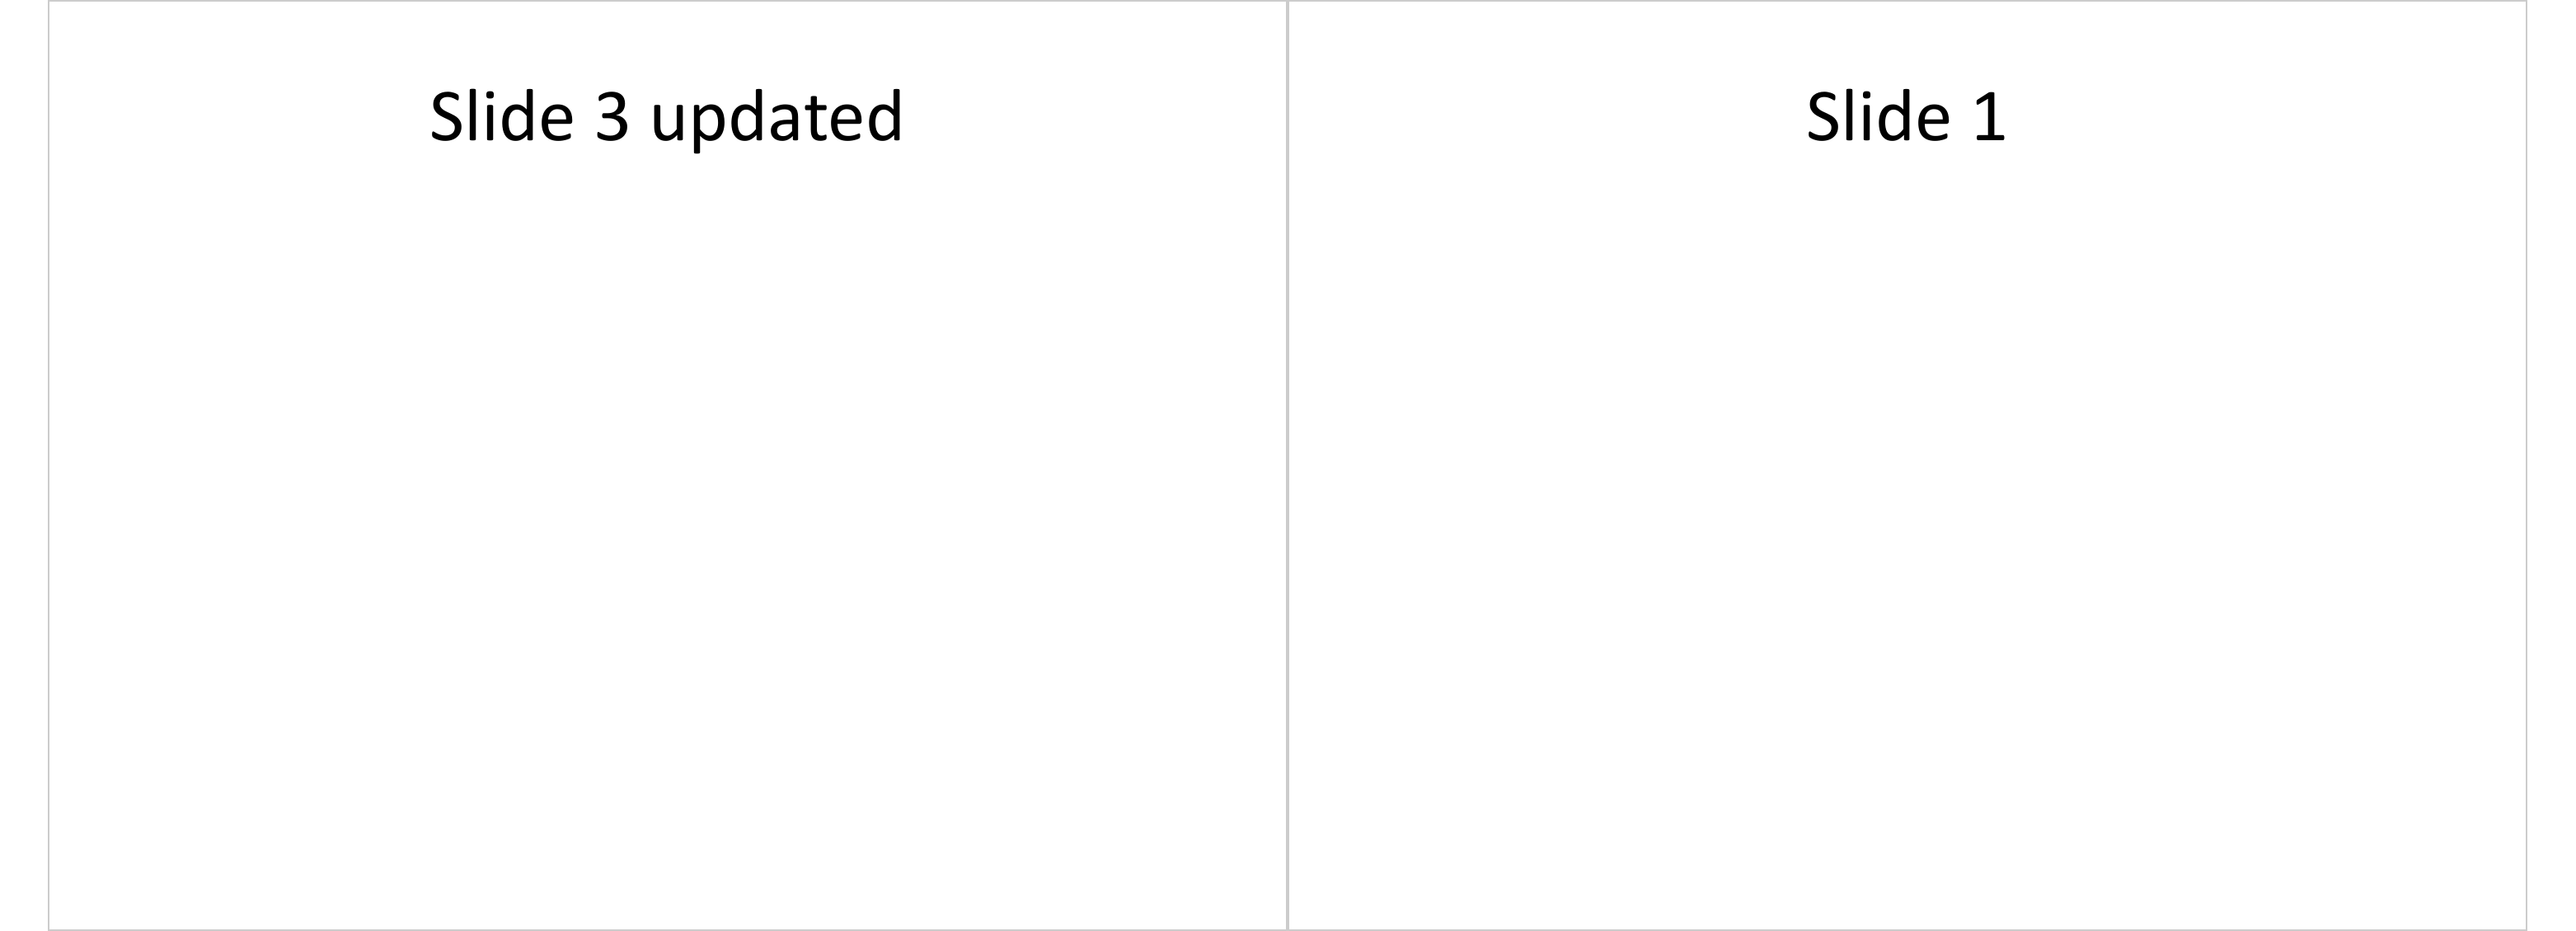
7.7 Slide content Manipulation
7.7.1 Remove content from a slide
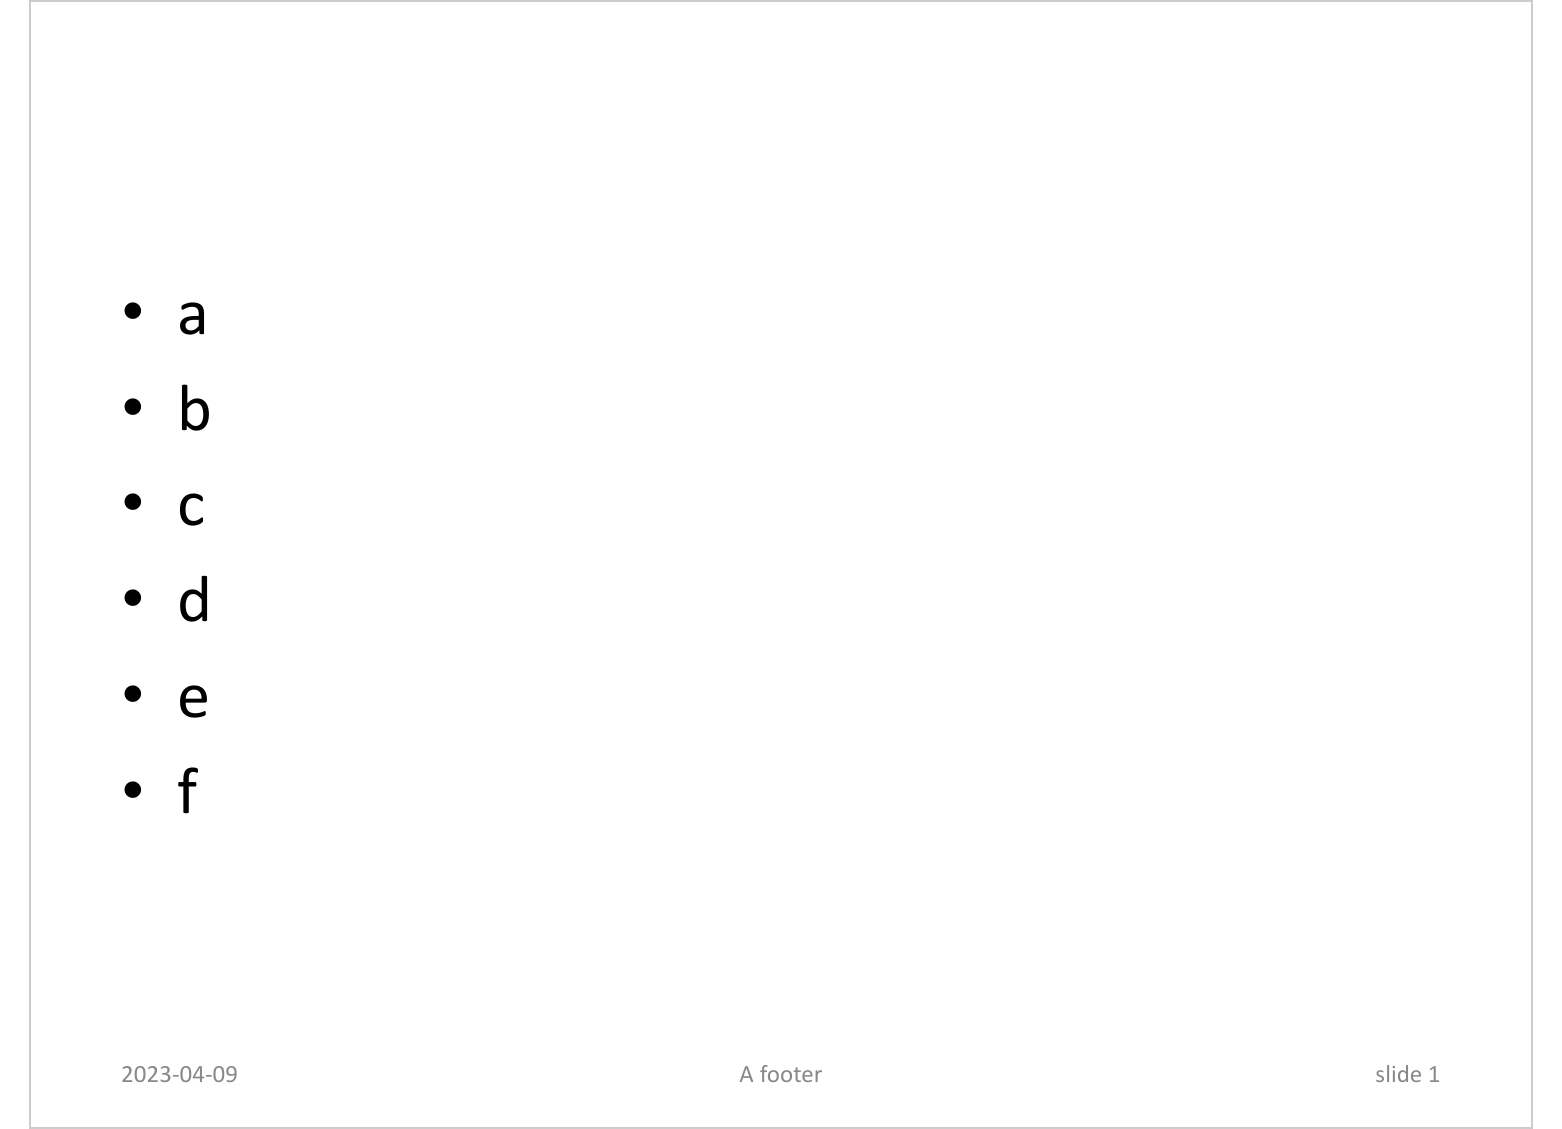
Use slide_summary() to easily identify shapes in the slide that can be removed.
type | id | ph_label | offx | offy | cx | cy | rotation | fld_id | fld_type | text |
|---|---|---|---|---|---|---|---|---|---|---|
character | character | character | numeric | numeric | numeric | numeric | integer | character | character | character |
title | 2 | Title 1 | 0.5 | 0.3 | 9.0 | 1.2 | Hello world | |||
ftr | 3 | Footer Placeholder 5 | 3.4 | 7.0 | 3.2 | 0.4 | A footer | |||
dt | 4 | Date Placeholder 4 | 0.5 | 7.0 | 2.3 | 0.4 | 2026-05-15 | |||
sldNum | 5 | Slide Number Placeholder 6 | 7.2 | 7.0 | 2.3 | 0.4 | slide 1 | |||
body | 6 | Content Placeholder 3 | 5.1 | 1.8 | 4.4 | 4.9 | abcdef | |||
n: 5 | ||||||||||
In the following example, the shape corresponding to type "title" will be
removed from the current slide:
7.7.2 External links
ph_hyperlink() adds a hyperlink to an existing placeholder in the current
slide. The argument href should contain a valid URL (i.e. starting with
http(s)).
doc <- read_pptx()
doc <- add_slide(doc, layout = "Title and Content")
doc <- ph_with(doc, "Blah blah blah", location = ph_location_type(type = "body"))
doc <- ph_hyperlink(doc,
  ph_label = "Content Placeholder 2", href = "https://cran.r-project.org")
print(doc, target = "static/office/example_ph_hyperlink.pptx")
7.7.3 Internal links
ph_slidelink() adds an internal link into an existing placeholder. The
argument slide_index should contain the index of the target slide.
doc <- read_pptx()
doc <- add_slide(doc, layout = "Title and Content")
doc <- ph_with(doc, "Blah blah blah", location = ph_location_type(type = "body"))
doc <- add_slide(doc, layout = "Title and Content")
doc <- ph_with(doc, "placeholder target", location = ph_location_type(type = "title"))
doc <- on_slide(doc, index = 1 )
doc <- ph_slidelink(doc,
  ph_label = "Content Placeholder 2", slide_index = 2)
print(doc, target = "static/office/example_ph_slidelink.pptx")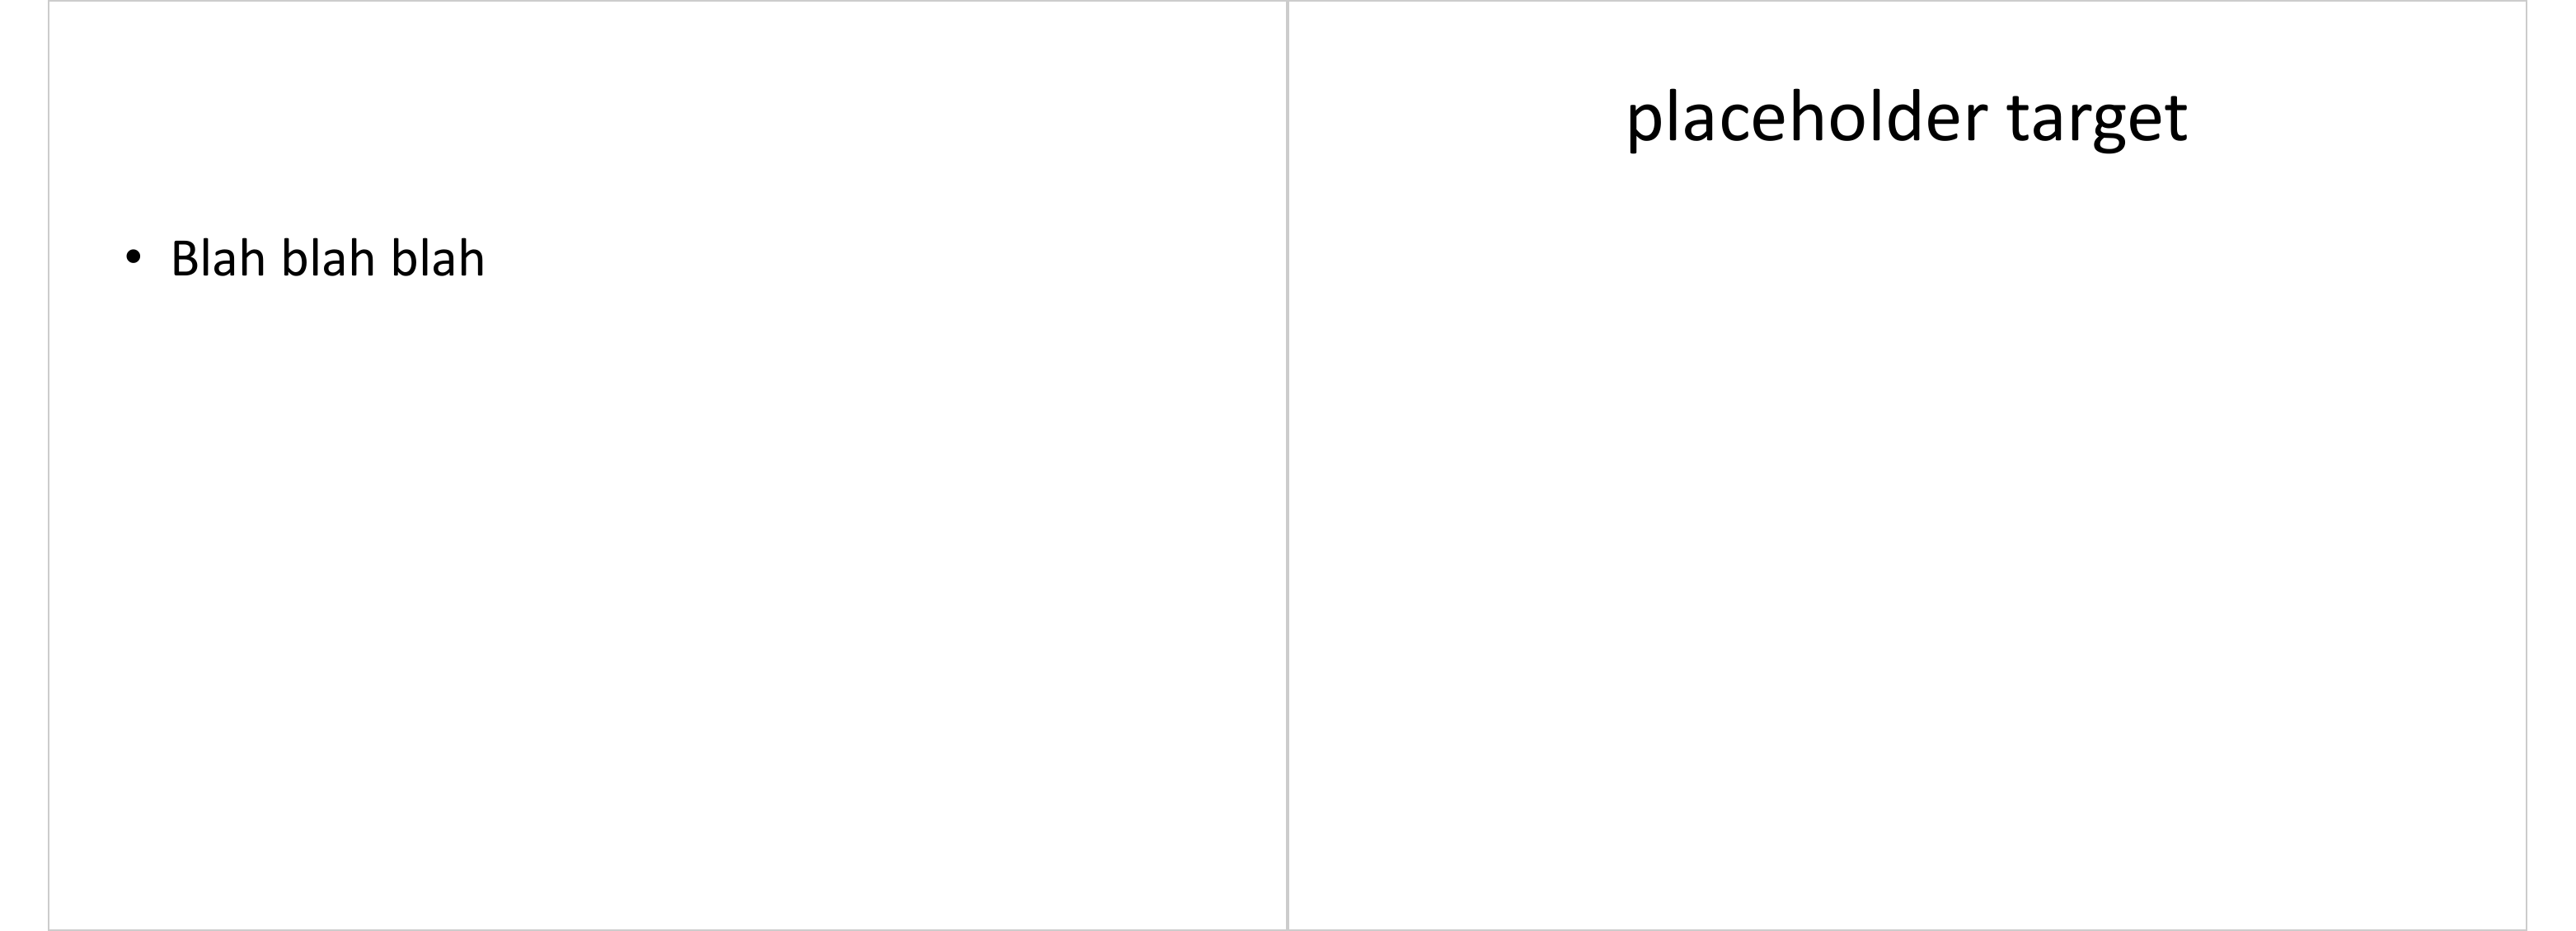
7.8 Speaker notes
Speaker notes are the comments attached to a slide that the presenter sees
in Presenter View but the audience does not. Use set_notes() on the
current slide. The text is placed in a notes placeholder identified by
notes_location_type() (typically "body") or notes_location_label().
doc <- read_pptx()
doc <- add_slide(doc, layout = "Title and Content")
doc <- ph_with(doc, "Quarterly results",
               location = ph_location_type(type = "title"))
doc <- set_notes(doc,
                 value = "Insist on the EU growth, mention the US slowdown.",
                 location = notes_location_type("body"))
print(doc, target = "speaker_notes.pptx")
Pass a block_list() instead of a character vector to use rich formatting
(bold, colour, multiple paragraphs) in the notes.